Research Article
Assessment of Plant Life-Form Diversity and Ecological Dynamics in Guntagola Forest Lingasugur Taluk Raichur District Karnataka, India
Theophilus Deenadayal1* and Tarun Jain2
1Research Scholar, Department of Botany, Sunrise University, Alwar, Rajasthan, India
2Associate Professor, Department of Botany, Sunrise University, Alwar, Rajasthan, India
2Associate Professor, Department of Botany, Sunrise University, Alwar, Rajasthan, India
*Corresponding author:Theophilus Deenadayal, Research Scholar, Department of Botany, Sunrise University, Alwar, Rajasthan, India E-mail: tddayal@gmail.com
Copyright: ©Theophilus Deenadayal, et al. 2025. This is an open access article distributed under the Creative Commons Attribution License, which permits unrestricted use, distribution, and reproduction in any medium, provided the original work is properly cited.
Article Information:Submission: 22/12/2024; Accepted: 07/01/2025; Published: 10/01/2025
Abstract
The study examines the diversity and ecological distribution of plant life forms in the Guntagola Forest, located in Lingasugur Taluk, Raichur District, Karnataka, India. Using Raunkiaer’s life-form classification system, the research investigates plant adaptation strategies in a semi-arid environment
characterized by rocky terrain, sparse vegetation, and limited rainfall. Data were collected through 48 systematically placed 10 m × 10 m quadrats across diverse habitats, including forest patches, grasslands, and rocky outcrops. Species richness, evenness, and spatial distribution were analyzed using GIS tools, and statistical methods were applied to evaluate the relationship between life forms and environmental variables. The results revealed a total of
531 plant species categorized into five major life-form classes: therophytes (243 species, 45.76%), phanerophytes (115 species, 21.66%), chamaephytes (73 species, 13.75%), hemicryptophytes (70 species, 13.18%), and cryptophytes (30 species, 5.65%). A significant deviation from Raunkiaer’s Normal
Spectrum was observed, with therophytes being highly dominant due to their adaptation to dry and disturbed conditions. In contrast, phanerophytes and hemicryptophytes showed reduced representation, likely due to habitat disturbance and climatic constraints. Environmental factors such as soil moisture and
temperature played a crucial role in shaping the distribution patterns of life forms. This study highlights the ecological significance of plant functional diversity in semi-arid regions and provides a comprehensive overview of life-form adaptations to specific climatic and edaphic conditions. The findings contribute to the understanding of biodiversity in the Guntagola Forest and underscore the need for conservation efforts to maintain ecological balance in this fragile ecosystem. Future research may focus on long-term monitoring of life-form dynamics and the impact of anthropogenic activities on vegetation composition.
Keywords:Plant Life Forms; Raunkiaer Classification; Semi-Arid Ecosystems; Species Diversity; Guntagola Forest; Lingasugur; Raichur; Ecological Adaptation
Introduction
Raunkiaer’s approach is particularly helpful for categorizing
plants in regions with seasonal climates, where the growing season
is dictated by the presence of frost and/or water scarcity. Climate is
therefore predicted to have a significant influence on the distribution
and diversity of life forms in European plant ecosystems. A
classification scheme for vascular plant life forms was put forth by
Christen Christiansen Raunkiaer in 1934. It was based on the location
and level of protection of the renewal buds during times that were not
conducive to plant growth, such as dry or cold seasons. The method is
based on the idea that plants adjust to (micro)climatic circumstances,
especially extremes like frost and drought, by using this strategy
to safeguard the perennating organs [1]. Considering that the life
forms of the Raunkiaer represent life-history features that maximize
organisms’ performance under a certain set of environmental
variables [2], we anticipate that life forms will react to temperature
and moisture gradients in a variety of habitat types. According to
earlier research, (continuous) trait syndromes exhibit significant
geographic variation at large spatial scales [3], and when responses
within distinct habitat types are taken into account, environmental
conditions can account for some of these patterns [4,5].
Around 1896, Warming was the first to use the term “Life
form” [7]. Plant life forms are characterized by their morphological
or vegetative adaptability to their surroundings. It can be useful
for comparing the kinds of flora found in various locations [8].
According to [9,10], the growth form is the real structure of the shoot
apex, whereas life form is the physiognomy of vegetation. However,
the growth form can be regarded as the plant’s general morphological
property that can be investigated. Based on physiognomy, several
ecologists attempted to categorize the different plant life forms [11].
Theophrastus, for instance, divided the vegetation or plant community
into species such as trees, shrubs, and herbs. For most ecologists, the
taxonomy of plant life forms was acceptable. The biological spectrum
is the range of plant life forms in a plant community, expressed as
a different ratio or percentage. This biological spectrum aids in
exposing the diverse vegetation kinds and climatic conditions of
various geographic places [12]. It is possible to identify the dominant
species in a natural environment or plant community and investigate
the effects of human activity on these ecosystems with the aid of
the biological spectrum. Numerous studies on plant life forms have
been conducted both in India [13-15] and internationally [16-19]. In cool-temperate climates, hemicryptophytes and chamaephytes
can survive, while therophytes and geophytes can endure in arid and
cold conditions. Many phanerophyte species are limited to areas that
don’t experience drought or frost frequently [31-35]. The Guntagola
Forest in Lingasugur Taluk is a semi-arid region with diverse flora
adapted to specific climatic and edaphic factors. This study employs
Raunkiaer’s life form classification system to analyze plant functional
diversity. The research aims to document the life form distribution,
examine species richness, and provide insights into the ecological
significance of these patterns.
Material and Methods
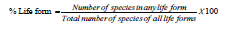
Study Area:
The Guntagola Forest is located in the Lingasugur Taluk,
characterized by rocky terrain, sparse vegetation, and a semi-arid
climate. It lies between 16.28°N latitude and 76.51°E longitude (Figure
1). Gulbarga District borders Lingasugur taluk on the north and west,
while Raichur District’s Devadurga taluk borders it on the east. North
Karnataka’s Lingasugur Taluk along with Guntagola Forest have a
semi-arid environment with hot summers and little precipitation.
In terms of agroclimate, it is located in the arid agroclimatic zone
in the northeast. The region typically receives 608 mm of rainfall
annually [6]. On average, there are roughly 45 rainy days in a year.
The majority of the rainfall, or roughly 66.9% of the annual rainfall,
falls between June and September during the southwest monsoon
season, according to an examination of the seasonal fluctuation of
rainfall. Nearly 24% comes from the northeast monsoon or postmonsoon
(October to December), with the remaining 9.1% coming
from dry weather and the pre-monsoon season (January to May) and
experiencing a mean annual temperature of 27°C.Vegetation Sampling and Calculation:
Vegetation data were collected using 10 m × 10 m quadrats
systematically placed across the study area. A total of 48 quadrats were
sampled, covering forest patches, grasslands, and rocky outcrops.
During the survey, most of the species were identified and recorded
on site, if immediate identification was not possible, specimens were
collected for later identification with keys. Unidentified plants were
collected, dried using standard herbarium techniques and identified.
Plant species identification was conducted using the following
references: Flora of Gulbarga District by Seetharam et al., (2000),
Flora of the Presidency of Madras (Volumes I to III) by Gamble
(1957), Flora of North Eastern Karnataka by N.P. Singh (1988),
and the detailed studies Flora of Karnataka (Volume I, 1984 and
Volume II, 1996) by Saldanha & Larsen. Photographs and voucher
specimens of the identified species were deposited in the Herbarium
of the Department of Botany at Sunrise University, Alwar, Rajasthan
(HSUR). The degree of dispersion of individual species within a
region in relation to the total number of species observed is referred
to as relative frequency [25].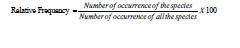
To develop the biological spectrum of the region, the percentage
distribution of these species in various living forms was determined
[24]. The resulting values were contrasted with Raunkiaer’s normal
spectrum [18]. The following formula was used to get the life-form
percentage:
Classification System:
Raunkier divided plants into five groups- Phanerophytes,
Chamaephytes, Hemicryptophytes, Cryptophytes, and Therophytesaccording
to where the renewal bud was found in unfavorable
conditions. Phanerophytes are plants that have renewal buds
positioned higher than 0.25 meters above the ground. Plants with
renewal buds that are less than 0.25 meters above the ground are
known as chamaephytes. Plants with renewal buds somewhat above
the earth’s crust are known as hemicryptophytes. Plants with an
underground renewal bud, such as a rhizome, bulb, or tuber, are
known as cryptophytes. Therophytes are primarily annual plants that,
under adverse conditions, develop seed as a renewal bud [9,18,20].Data Analysis:
Species richness and evenness were calculated for each quadrat.
Spatial distribution maps were generated using GIS software, and
statistical analyses were performed to evaluate the relationship
between life forms and environmental variables.Results and Discussion
Diversity of Species Composition:
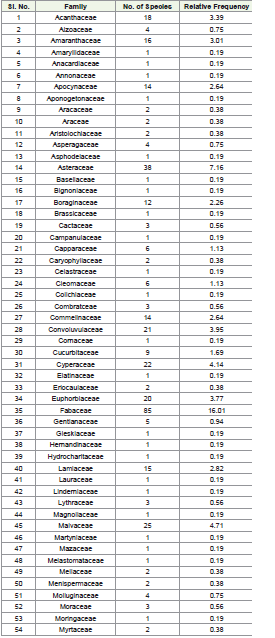
A thorough analysis of plant diversity revealed that 90 families
were represented, varying significantly in the number of genera and
species within each family. The family Acanthaceae had 11 genera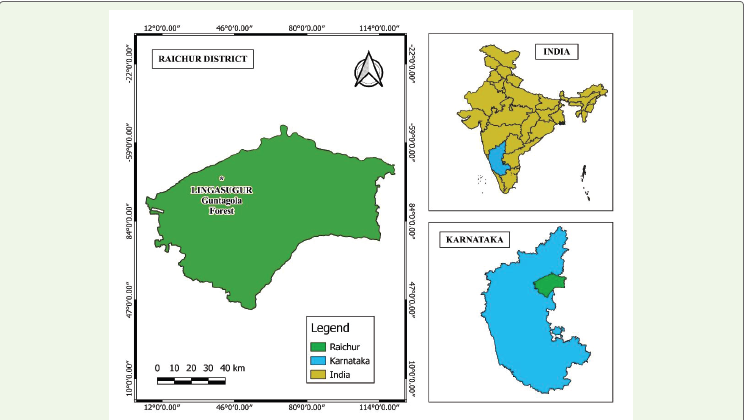
comprising 18 species, whereas Amaranthaceae also exhibited 11
genera but with 16 species. Notably, Apocynaceae included 12 genera
and 14 species. In contrast, Aizoaceae and Asperagaceae displayed
comparatively lower diversity, with 2 genera and 4 species each.
Among the prominent families, Asteraceae emerged as one of the
richest families, comprising 30 genera and 38 species, followed closely
by Fabaceae, which exhibited the highest diversity with 38 genera and
85 species. The grass family, Poaceae, was another dominant group,
containing 48 genera and 60 species. Families such as Convolvulaceae
and Euphorbiaceae demonstrated moderate richness, comprising
8 genera, 21 species, and 10 genera, 20 species, respectively. The
Malvaceae family contributed significantly to species diversity,
including 12 genera and 26 species.
Several families exhibited lower diversity, containing only
1 genus and 1 species, reflecting minimal representation in the
survey. These include Amaryllidaceae, Anacardiaceae, Annonaceae,
Aponogetonaceae, Asphodelaceae, Basellaceae, Bignoniaceae,
Brassicaceae, Campanulaceae, Celastraceae, Colchicaceae, Cornaceae,
Elatinaceae, Gieskiaceae, Hernandinaceae, Hydrocharitaceae,
Lauraceae, Linderniaceae, Magnoliaceae, Martyniaceae, Mazaceae,
Moringaceae, Nymphaceae, Nelumbonaceae, Onagraceae,
Papaveraceae, Passifloraceae, Plumbaginaceae, Polygonaceae,
Pontederiaceae, Scrophulariaceae, Simaroubaceae, Typhaceae,
Ulmaceae, Violaceae, Vitaceae, Xyridaceae, Isoetaceae, Selaginellaceae,
Ophioglossaceae, and Pteridaceae. The survey also revealed moderate
representation in families such as Boraginaceae (6 genera, 12 species),
Cyperaceae (7 genera, 22 species), and Plantaginaceae (5 genera, 5
species). Cucurbitaceae showed 8 genera and 9 species, while Rubiaceae
exhibited 7 genera and 7 species. Families with intermediate diversity
include Molluginaceae with 3 genera and 4 species, Orobanchaceae
with 2 genera and 6 species, and Nyctaginaceae with 2 genera and
3 species. Similarly, Rhamnaceae and Rutaceae displayed 4 species
each, while Lamiaceae and Verbenaceae represented 11 genera,
15 species and 5 genera, 6 species, respectively. In families where
species richness was comparatively low, such as Caryophyllaceae
and Lythraceae, 2-3 species were recorded. The Solanaceae family
showed a moderate diversity of 3 genera comprising 5 species. This
comprehensive survey highlights the dominant role of families like
Fabaceae, Poaceae, and Asteraceae in shaping plant diversity, while
numerous smaller families exhibited limited representation with only
single genera and species. These findings underscore the variability
in floristic richness across families and their ecological significance
within the surveyed region (Table 1).
A comprehensive survey revealed the presence of 91 generic names
of plant species, with varying numbers of species represented under
each genus. The genus Barleria comprises 3 species, while Blepharis,
Dipteracanthus, Rungia, Trianthema, Zaleya, Aerva, Calotropis,
Aristolochia, Bidens, Launaea, Tricholepis, Cordia, Trichodesma,
Opuntia, Polycarpea, Terminalia, Convolulus, Cuscuta, Cucumis,
Fuirena, Schoenoplectiella, Eriocaulon, Chrozophora, Jatropha,
Stylosanthes, Delonix, Anisomeles, Leucas, Ammania, Abutilon,
Trimufetta, Glinus, Boehravia, Sesamum, Chloris, Dichanthium,
Dinebra, Setaria, Themeda, Urochloa, Lantana, and Cissus each
account for 2 species. The genera Justicia, Alternthera, Amaranthus,
Merremia, Acalypha, Albizia, Ocimum, Corchorus, Grewia, Pavonia,
Aristida, Portulaca, and Solanum include 3 species each. The genera
Blumea, Heliotropium, Commelina, Cyanotis, Vachellia, and Striga
each have 5 species. Cleome and Fimbristylis both consist of 6 species,
while Alycicarpus contains 6 species as well. Notably, Euphorbia has
7 species, Ipomea, Cyperus, and Crotalaria each include 10 species,
and Indigofera stands out with 12 species. Genera with intermediate
diversity include Murdannia, Capparis, Rhynchosia, Senna, Tephrosia,
Hibiscus, Sida, Phyllanthus, Eragrostis, Polygala, and Ziziphus, each
comprising 4 species.
The study encompassed an extensive assessment of plant families,
identifying a total of 90 families with varying numbers of species
and relative frequencies. Among these, Fabaceae was found to be the
most dominant family, comprising 85 species, accounting for 16.01%
of the total relative frequency, reflecting its widespread adaptability
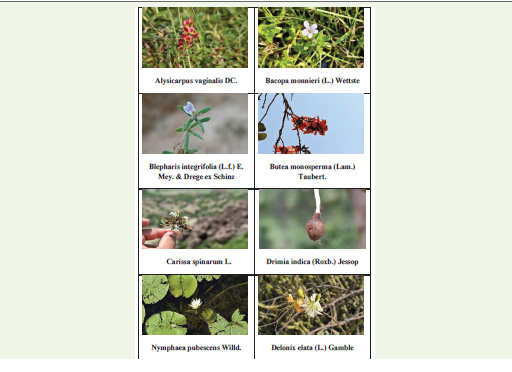
and ecological significance in the study area (Plate 1). This was
followed by Poaceae, represented by 60 species (11.30%), which
highlights its critical role in providing essential vegetation cover,
particularly in grasslands and open habitats. The third most prevalent
family was Asteraceae, with 38 species (7.16%), underscoring its
wide adaptability and prominence in various habitats. Families
with a moderate representation included Cyperaceae with 22
species (4.14%), known for its dominance in wetland ecosystems,
and Malvaceae, represented by 25 species (4.71%), which indicates
its ecological diversity and prevalence in both cultivated and wild
settings. Euphorbiaceae followed closely with 20 species (3.77%),
highlighting its ecological versatility and significant contribution to
biodiversity. Other noteworthy families include Acanthaceae with
18 species (3.39%), Amaranthaceae with 16 species (3.01%), and
Apocynaceae with 14 species (2.64%), all of which play crucial roles
in maintaining ecological balance and providing resources such as
nectar for pollinators.There are a number of ways that herbaceous
species can tolerate drastic changes in climate [38].
A range of families showed notable, albeit smaller, representations,
such as Convolvulaceae (21 species, 3.95%), Commelinaceae (14
species, 2.64%), and Boraginaceae (12 species, 2.26%), indicating their
A range of families showed notable, albeit smaller, representations,
such as Convolvulaceae (21 species, 3.95%), Commelinaceae (14
species, 2.64%), and Boraginaceae (12 species, 2.26%), indicating their
with specialized ecological adaptations. Similarly, aquatic families
such as Nymphaceae, Hydrocharitaceae, and Pontederiaceae were
represented minimally, suggesting their occurrence in specific aquatic
or semi-aquatic ecosystems. Meanwhile, the diversity observed across
90 plant families demonstrates a rich and varied floristic composition,
with dominant families like Fabaceae, Poaceae, and Asteraceae
contributing significantly to the regional biodiversity. Families with
moderate or low representation provide essential ecosystem services
and highlight the intricate ecological dynamics present in the study
area. These findings underscore the importance of preserving both
dominant and less-represented families to maintain ecological
balance and biodiversity.
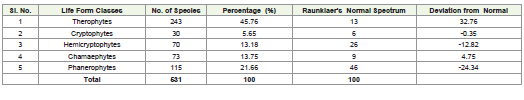
Biological Spectrum:
The study analyzed the distribution of plant species based on
Raunkiaer’s life form classification, revealing significant variations
in the proportion of life form classes. The total number of species
analyzed was 531, categorized into five primary life form classes:
Therophytes, Cryptophytes, Hemicryptophytes, Chamaephytes,
and Phanerophytes (Table 2). The results were compared with
Raunkiaer’s Normal Spectrum to assess deviations from the expected
global norms. Therophytes were found to be the most dominant life
form, accounting for 243 species, representing 45.76% of the total
flora. This percentage significantly exceeds Raunkiaer’s Normal
Spectrum value of 13%, resulting in a positive deviation of 32.76%.
The predominance of therophytes reflects the adaptability of annual
plants to the region’s climatic conditions, particularly in areas with a
pronounced dry season or disturbed habitats. Particularly, in Central
Europe’s temperate zone, hemicryptophytes were the most prevalent
living type. On the other hand, chamaephyte and therophyte species
were more prevalent in arid temperate zones and the Mediterranean
[1].Phanerophytes, the second most represented class, included
115 species, constituting 21.66% of the total. However, this value is
markedly lower than the Normal Spectrum value of 46%, indicating
a negative deviation of 24.34%. This discrepancy suggests reduced
representation of woody, perennial plants, which may be attributed
to habitat disturbance, anthropogenic activities, or climatic factors
limiting the growth of tall vegetation. Chamaephytes, with 73 species
(13.75%), showed a slight positive deviation of 4.75% from the
Normal Spectrum value of 9%. This indicates the adaptability of small
shrubs and low woody plants to the local environmental conditions,
particularly in semi-arid or nutrient-poor soils. Hemicryptophytes
accounted for 70 species (13.18%), which is notably lower than the
Normal Spectrum value of 26%, resulting in a negative deviation of
12.82%. This underrepresentation might be linked to the ecological
conditions of the study area, which may not favor the persistence
of perennial herbaceous plants with basal buds surviving harsh
conditions. Cryptophytes were the least represented life form,
comprising 30 species and contributing 5.65% to the total flora. This
is close to the Normal Spectrum value of 6%, with a minimal negative
deviation of 0.35%. This alignment suggests the presence of species
adapted to surviving unfavorable seasons through underground
storage organs. Hemicryptophytes may lose aboveground biomass in
cold areas with frequent frost, protecting their perennating buds that
are at or near the soil surface [36]. However, the life form analysis
indicates a predominance of therophytes, highlighting the region’s
adaptation to dry or disturbed conditions, while phanerophytes
and hemicryptophytes were underrepresented compared to global
norms. These deviations provide insights into the ecological and
climatic influences shaping the vegetation structure and offer a basis
for understanding the adaptive strategies of plant species in the study
area (Figure 2). The current analysis of the many Raunkier plant life
forms in Ahmedabad’s Law Garden reveals that a high proportion of
phanerophytes suggests a phanaerophyticphytoclimate [22].
Distribution Patterns:
The spatial distribution of plant life forms in the Guntagola Forest
was distinctly influenced by habitat characteristics. Hemicryptophytes
and therophytes exhibited high prevalence in open grasslands and
rocky outcrops, where environmental conditions such as limited soil
depth, reduced moisture retention, and high exposure to sunlight
created challenging growth environments. Hemicryptophytes, with
renewal buds at or near the soil surface, demonstrated resilience
in these habitats by adapting to periodic drought and temperature
extremes. Therophytes, primarily annual plants, thrived in these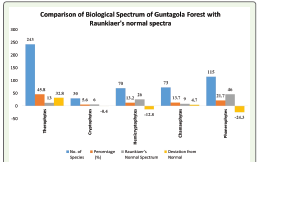
areas due to their ability to complete their life cycles quickly under
favorable conditions and survive unfavorable periods as seeds.
Conversely, phanerophytes, which include trees and large shrubs with
renewal buds positioned above 0.25 meters from the ground, were
primarily restricted to forested patches. These habitats provided the
necessary stability, moisture availability, and shade for their growth
and reproduction. Short-lived therophytes can survive as seeds that
dormantly rest in seed banks until favourable circumstances for
regrowth and germination occur [37]. Geophytes, characterized by
underground storage organs such as bulbs and rhizomes, were found
in specific microhabitats such as shaded areas and moist depressions,
where environmental conditions favored prolonged dormancy and
resource conservation. Similarly, hydrophytes, adapted to aquatic and
semi-aquatic conditions, were confined to seasonal water bodies and
marshy areas, reflecting their dependence on waterlogged soils and
consistent moisture availability. According to the biological spectrum
construction and life form classification of the Chiktan valley of
Kargil district in the Ladakh region of the North West Himalaya,
hemicryptophytes (40.50%) and therophytes (24.05%) dominated the
local landscape, with chamaephytes (17.72%), phanerophytes, and
geophytes (8.86%) following closely behind [23].
Environmental Influences:
Environmental factors, particularly soil moisture and
temperature, emerged as significant determinants of plant life form
distribution in the Guntagola Forest. The dominance of therophytes
in arid and disturbed habitats highlights their adaptation to low
soil moisture and high temperatures, enabling them to establish,
reproduce, and persist in environments with extreme seasonal
variability. These life forms leveraged seed dormancy as a survival
mechanism during adverse conditions. In contrast, hydrophytes
exhibited a strong dependence on waterlogged or moisture-rich
soils, thriving in areas with seasonal or permanent water availability.
These species showed a restricted distribution pattern, confined to
water bodies and wetlands. This study underscores the critical role
of environmental variables in shaping the structure and diversity of
vegetation, with life forms exhibiting unique adaptive strategies to
persist under specific climatic and edaphic conditions. Such findings
provide a framework for understanding plant community responses
to environmental gradients and for implementing conservation
strategies tailored to semi-arid ecosystems like the Guntagola Forest.
A similar study was conducted, the flora of Tons Valley in Garhwal
Himalaya is dominated by phanerophytes (29.06%) and therophytes
(17.83%) and others are least in percentage [12].Conclusion
The study provides a comprehensive evaluation of plant life forms
in the Guntagola Forest, employing Raunkiaer’s classification system
to analyze the ecological adaptations of vegetation in a semi-arid
environment. The dominance of therophytes, constituting 45.76%
of the flora, underscores their adaptability to dry and disturbed
conditions, while the reduced representation of phanerophytes
(21.66%) and hemicryptophytes (13.18%) highlights the influence
of climatic constraints and anthropogenic activities on woody and
perennial species. Significant deviations from Raunkiaer’s Normal
Spectrum were observed, reflecting the unique environmental
conditions of the study area. These findings underscore the ecological
importance of plant life forms in maintaining biodiversity and
ecosystem stability in semi-arid regions. The research highlights
the need for targeted conservation efforts to preserve the delicate
balance of this ecosystem, particularly in the face of ongoing habitat
degradation and climate variability. Further studies focusing on
long-term ecological dynamics and human impacts are essential
to enhance conservation planning and sustainable management of
semi-arid landscapes.
Acknowledgement
The authors would like to extend their deepest gratitude to
Raviraju Balappa D and Vigneshwaran for their invaluable time
and insights, pivotal to this study’s success. They also profoundly
appreciate Sunrise University, Alwar, Rajasthan, for its institutional
support. The authors are especially indebted to Helen Lalitha Kumari
J James for their expert guidance and unwavering support, which
were instrumental throughout the research process.
References
Citation
Theophilus Deenadayal, Jain T. Assessment of Plant Life-Form Diversity and Ecological Dynamics in Guntagola Forest Lingasugur Taluk Raichur District Karnataka, India. J Plant Sci Res. 2025;12(1): 271