Research Article
Comparison of BMI and Skeletal Muscle Mass with Phase Angle in Cancer Patients Receiving Chemotherapy
Sanjith Saseedharan*, Ankita Pandey and Megha Shinde
Department of Nutrition, S.L Raheja Hospital Fortis associate (Mahim), Mumbai, Maharashtra, India
*Corresponding author:Saseedharan S, Department of Nutrition, S.L Raheja Hospital Fortis associate (Mahim), Mumbai, Maharashtra, India. E-mail Id: docsanjith@rediffmail.com
Article Information:Submission: 03/02/2025; Accepted: 19/03/2025; Published: 22/03/2025
Copyright: © 2025 Saseedharan S, et al. This is an open access article distributed under the Creative Commons Attribution License, which permits unrestricted use, distribution, and reproduction in any medium, provided the original work is properly cited.
Abstract
Nutrition is an important factor to assess the quality of life and functionality in patients receiving chemotherapy. Malnutrition has been observed in patients receiving chemotherapy; hence it is an important factor contributing to recovery. The article explores the growing significance of phase angle in comparison
with Body mass Index and Skeletal muscle mass in patients receiving chemotherapy.
Introduction
Patient with cancer undergo dynamic and longitudinal changes in
nutritional status and body composition. In order to measure the body
composition, one of the measures used is the Bioelectrical impedance
analysis. BIA is an inexpensive, non-invasive and reproducible
technique which uses electric current through body to measure
impedance. On the other hand, we have phase angle which is a value
derived from the BIA and is an indicator of cell membrane health and
integrity.[1] Higher PA values may reflect better cell function, higher
muscle mass and lower fat mass. [2] The study aimed to analyse the
relationship between phase angle with BMI and skeletal muscle mass
in patients receiving chemotherapy in one day at a particular health
care institution (S.L Raheja Hospital Fortis, Mumbai).
Material and Methods
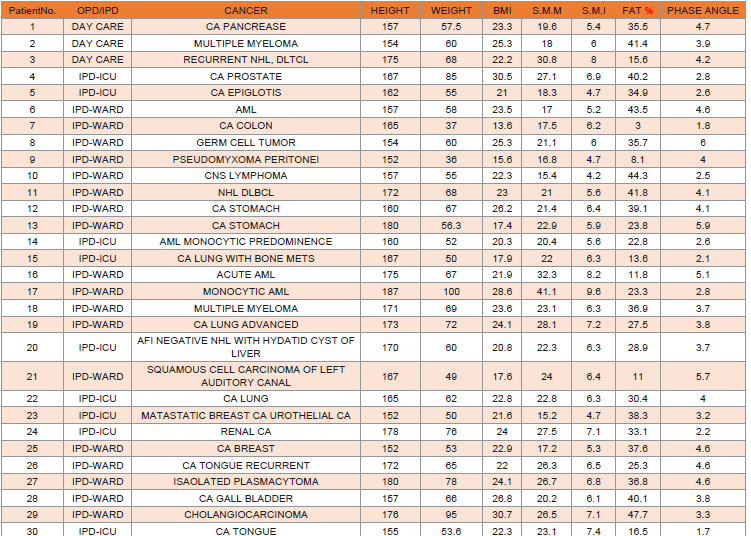
A point prevalence study was conducted on patient with various
forms of cancer undergoing chemotherapy. The BMI, skeletal muscle
mass and phase angles were measured using our machinery in 30
patients who currently received chemotherapy. The measurements
were done in one-day and the data was collected as below.
DLTCL- diffuse lymphocytic T- cell Lyphoma;
DLTCL- diffuse lymphocytic T- cell Lyphoma;
The above data shows that Body mass index was variable in
each individual with a different form of cancer but all receiving
chemotherapy. The phase angle has a correlation with the BMI
which is illustrated in the graphs below. Skeletal muscle mass is a
key component of fat free mass and metabolic health. The lower the
Skeletal muscle mass, indicates sarcopenia which increases the risk
of poor health outcomes in the form of premature mortality and
increased morbidity [3].
The skeletal muscle mass is calculated using height and weight,
which has a normal range of 10-20% in males and 18-28% in females.
It is important to note that we are measuring the skeletal muscle mass
in patients with cancer which may vary.
Statistical Analysis:
A multiple linear regression was conducted to assess the
predictors of phase angle in patients undergoing chemotherapy.
The model included height, weight, skeletal muscle mass (SMM),
skeletal muscle index (SMI), and fat percentage as predictors.• The overall model was not statistically significant (F (5,24) =1.74, p=0.165), explaining 11% of the variance in phase angle (Adjusted R2=0.11).
• Significant predictors:
o Weight: A significant negative relationship was found between weight and phase angle (β=−2.34, p=0.017), indicating that higher weight was associated with lower phase angle.
o Skeletal Muscle Mass (SMM): A significant positive relationship was observed between SMM and phase angle (β=2.22, p=0.015), suggesting that greater muscle mass was associated with higher phase angle.
o Fat Percentage: A significant positive relationship was found between fat percentage and phase angle (β=1.58, p=0.020), indicating that higher fat percentage was associated with a better phase angle.
• Non-significant predictors:
o Height (p=0.645) and Skeletal Muscle Index (SMI) (p=0.738) did not show significant relationships with phase angle.
These findings suggest that SMM and fat percentage play
important roles in determining phase angle in chemotherapy
patients, while weight appears to have an opposing effect. However,
the model’s overall explanatory power remains modest, indicating
that other factors likely influence phase angle.
Implications:
• Skeletal Muscle Mass (SMM)The significant positive relationship between SMM and phase angle highlights the importance of maintaining or increasing muscle mass in cancer patients undergoing chemotherapy. SMM is a key determinant of cellular health, which phase angle reflects, suggesting that interventions to preserve muscle mass could improve overall health outcomes. It is important to note here that the above is seen in the regression analysis as explained above.
• Weight:
The negative association between weight and phase angle suggests
that simply increasing weight, especially if it involves non-muscle
mass (e.g., fat), does not necessarily improve cellular health. This
implies that clinicians should focus on muscle preservation rather
than just weight gain during chemotherapy.• Fat Percentage:
The significant positive relationship with phase angle implies
that body fat, although often viewed negatively, may play a role in
maintaining cellular integrity in cancer patients. This finding requires
further investigation to understand how fat distribution and quality
impact phase angle.• Model Limitations:
The overall model only explains a small portion of the variance
in phase angle (11%), suggesting that other factors, such as disease
severity, inflammation, or hydration status, might also influence
phase angle. Future studies with larger sample sizes and more
comprehensive data could provide a clearer picture of the factors
contributing to phase angle in cancer patients.• Suppressor Effects and Multicollinearity:
o SMM is highly correlated with other body composition
parameters, such as weight and skeletal muscle index
(SMI). When these variables are included in the
regression model, SMM’s unique contribution to phase
angle becomes more apparent after controlling for shared
variance.o In simple correlation, SMM’s effect on phase angle might be masked by other variables influencing both SMM and phase angle. However, in regression, when those confounding factors are controlled, the independent impact of SMM emerges.
• Multivariable Contribution:
o Even if SMM alone does not show a strong correlation
with phase angle, its combined effect along with
other predictors in the regression model could still be
meaningful.o Essentially, regression helps isolate the independent role of SMM in predicting phase angle, which may not be evident when looking at simple correlations.
• Sample Size Considerations:
o With a small sample size, correlation estimates can be
unstable, leading to non-significant results. Regression
analysis, by incorporating multiple variables, may still detect
an effect that was not apparent in the correlation matrix.Results
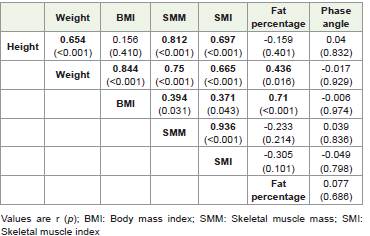
Body composition parameters correlation:
Values are r (p); BMI: Body mass index; SMM: Skeletal muscle
mass; SMI: Skeletal muscle indexPhase angle specific correlation
Phase Angle-Specific Correlation Analysis:
1. Phase Angle and Height:
o Correlation: r=0.04, p=0.832
o There is no significant relationship between height and phase angle.
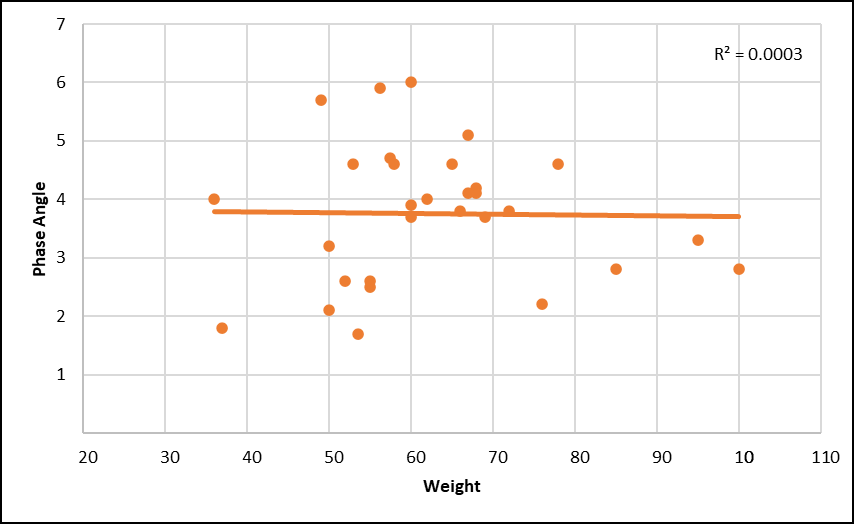
2. Phase Angle and Weight:
o Correlation: r=−0.017, p=0.929
o There is no significant relationship between weight and phase angle.
3. Phase Angle and BMI:
o Correlation: r=−0.006, p=0.974
o There is no significant relationship between BMI and phase angle.
4. Phase Angle and Skeletal Muscle Mass (SMM):
o Correlation: r=0.039, p=0.836
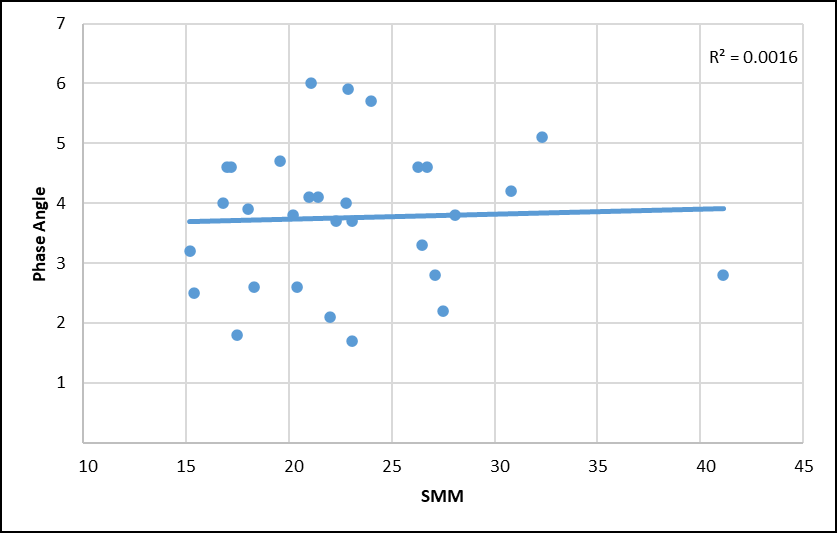
o There is no significant relationship between SMM and
phase angle.
5. Phase Angle and Skeletal Muscle Index (SMI):
o Correlation: r=−0.049, p=0.798
o There is no significant relationship between SMI and phase angle.
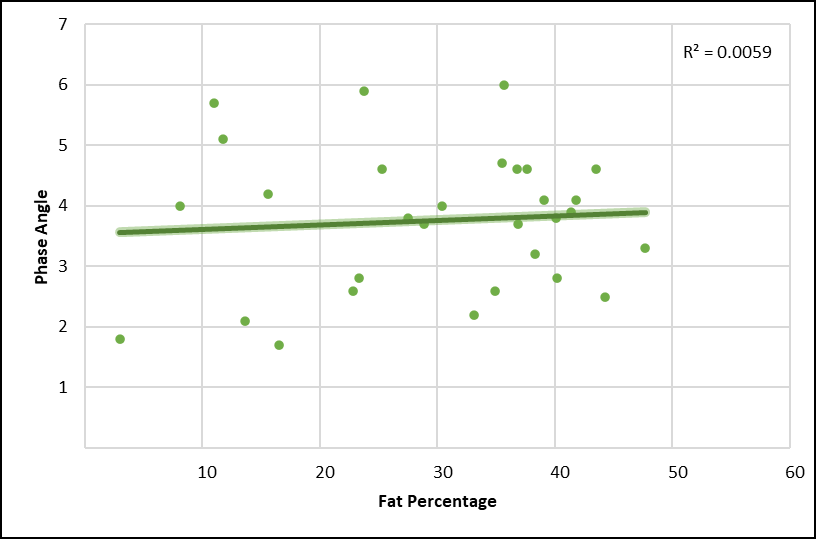
6. Phase Angle and Fat Percentage:
o Correlation: r=0.077, p=0.686
o There is no significant relationship between fat percentage and phase angle.
5. Phase Angle and Skeletal Muscle Index (SMI):
o Correlation: r=−0.049, p=0.798
o There is no significant relationship between SMI and phase angle.
6. Phase Angle and Fat Percentage:
o Correlation: r=0.077, p=0.686
o There is no significant relationship between fat percentage and phase angle.
Discussion
No significant correlations were observed between phase
angle and any of the anthropometric or body composition variables,
including height, weight, BMI, SMM, SMI, and fat percentage.
o Correlation measures only the direct pairwise relationship between two variables without accounting for other factors.
o Correlation measures only the direct pairwise relationship between two variables without accounting for other factors.
Regression, on the other hand, evaluates the relationship
between the dependent variable (phase angle) and multiple
predictors simultaneously, adjusting for the influence of
other variables.
Although simple correlation analysis did not indicate a significant
relationship between SMM and phase angle, multiple regression
analysis identified SMM as a significant predictor. This discrepancy
can be attributed to the fact that correlation measures only the direct
relationship between two variables, while regression accounts for
multiple predictors simultaneously, adjusting for shared variance. In
this study, the high correlation of SMM with other anthropometric
variables, particularly weight and skeletal muscle index, may
have masked its direct effect on phase angle in the correlation
analysis. However, when included in the regression model, SMM’s
independent contribution became evident. These findings underscore
the importance of multivariable approaches in evaluating body
composition predictors of phase angle.
Summary
A total of 30 patients were analysed, of which 33% were females.
Skeletal Muscle Mass (SMM) is the strongest predictor of phase angle,
highlighting its role in maintaining cellular health and integrity. BMI
and Weight show weak relationships with phase angle, suggesting
that weight alone is not a good indicator of phase angle, and the
muscle mass component (SMM) likely plays a more significant role.
Fat Percentage and SMI do not show significant correlations with
phase angle, suggesting that these variables may not be as important
in determining phase angle in this specific sample.
This study can aid in providing us with an insight in increasing
nutrition in order to increase the skeletal muscle mass in cancer
patients. With this insight, the phase angle measurements would be
higher which would correlate with the cell membrane health, hydration
and nutrition status in order to guide us towards their recovery and
reduce morbidity [4]. Moreover, it is reported there is a statistically
weakly positive correlation was found between body mass index and
phase angle values (p<0.05) seen in study [5]. Statistically moderate
positive correlation was found between body muscle and phase angle
values (p<0.05). In addition, as mentioned in many sources, the phase
angle can be an indicator of the integrity and functional adequacy
of the cells, especially in diseases with catabolism effect. In order to
increase phase angle, one can include a balanced diet which includes
mediterranean diet benefiting in preventing cardiovascular diseases,
promoting longevity and supporting health aging.[6] The nutrition
must target a protein rich and high protein intake in forms of enteral
and parenteral nutrition.[7-9]
References
Citation
Saseedharan S, Pandey A, Shinde M. Comparison of BMI and Skeletal Muscle Mass with Phase Angle in Cancer Patients Receiving Chemotherapy. Indian J Nutri. 2025;12(1): 313.