Research Article
Nutritional Status Assessment in Chronic Liver Disease Patients According to Severity and Etiology
Anamitra Hait*
Physician and ICU in charge, KG Hospital, Chittaranjan, West Bengal, India
*Corresponding author: Anamitra Hait, Physician and ICU in Charge, KG Hospital, Chittaranjan, West Bengal, India, E-mail Id: anamitrahait241@gmail.com
Article Information: Submission: 21/12/2024; Accepted: 10/01/2025; Published: 15/01/2025
Copyright: © 2025 Hait A. This is an open access article distributed under the Creative Commons Attribution License, which permits unrestricted use, distribution, and reproduction in any medium, provided the original work is properly cited.
Introduction
Chronic liver disease (CLD) is a progressive condition marked by
the gradual deterioration of liver functions over a period exceeding
six months. The liver’s ability to synthesize clotting factors and
proteins, detoxify harmful metabolic byproducts, and excrete bile is
significantly impaired in CLD [1,2]. This progressive damage often
arises from continuous inflammation, destruction, and regeneration
of liver tissue, ultimately resulting in fibrosis and cirrhosis. Cirrhosis,
the terminal stage of CLD, is characterized by diffuse hepatic
fibrosis, nodular regeneration, disruption of liver architecture,
vascular reorganization, and extracellular matrix deposits [3,4]. The
etiological spectrum of CLD is diverse, encompassing prolonged
alcohol abuse, toxins, infections, autoimmune diseases, genetic
predispositions, and metabolic disorders.In the Indian context,
liver diseases are increasingly recognized as significant public health
concerns. Notably, India accounted for 18.3% of the two million
global liver disease-related deaths in 2015. Since 1980, the mortality
attributable to cirrhosis and related complications has shown an
upward trajectory in India, contrasting with declining trends in other
Asian countries [5-7]. This rise can be attributed to a cultural and
lifestyle shift, including greater adoption of Western dietary habits,
sedentary lifestyles, and diminishing societal taboos surrounding
alcohol consumption. Consequently, alcohol-related liver disease
and metabolic-associated fatty liver disease (MAFLD) have emerged
as prominent contributors to CLD, surpassing viral causes. Cirrhosis
and CLD collectively accounted for 2.1% of all deaths in India in 2016,
underscoring the urgency of addressing this escalating healthcare
burden.A significant and potentially reversible complication of
cirrhosis is malnutrition, which adversely affects disease progression
and patient outcomes. Malnutrition in cirrhosis has been identified
as an independent predictor of mortality, with malnourished patients
exhibiting a significantly higher incidence of complications, including
sepsis, uncontrolled ascites, hepatic encephalopathy, spontaneous
bacterial peritonitis, and hepatorenal syndrome, compared to well nourished
individuals [9,10]. Studies, including those by Biyyani et al.
and Alberino et al., have reinforced this association, emphasizing the
critical role of nutritional status in determining survival outcomes.
Sarcopenia, characterized by skeletal muscle loss, is a common
manifestation of malnutrition in cirrhosis, observed in up to 60% of
patients. Its prevalence correlates with the severity of liver disease, as
measured by the Child-Turcotte-Pugh (CTP) score, and contributes
significantly to complications such as hepatic encephalopathy[11,12].
The pathophysiology of malnutrition in CLD is multifaceted.
Altered metabolic processes in cirrhosis lead to disruptions in
protein, fat, and carbohydrate metabolism. For instance, decreased
hepatic and muscle glycogen reserves force the body to rely on
fats and proteins as alternative energy sources, often exacerbating
protein-calorie malnutrition. Additionally, increased resting energy
expenditure (REE) and hypermetabolism, prevalent in a subset
of cirrhotic patients, further contribute to nutritional depletion.
Conditions such as ascites exacerbate these metabolic alterations,
increasing the risk of sarcopenia and malnutrition [13,14].
Sarcopenia in CLD is compounded by factors such as impaired
amino acid metabolism, increased muscle protein breakdown, and
reduced protein synthesis. The decline in the ratio of branched-chain
amino acids (BCAAs) to aromatic amino acids (AAAs) not only
contributes to muscle wasting but also predisposes patients to hepatic
encephalopathy. Overnight fasting, often resulting in a starvationlike
state, accelerates gluconeogenesis and lipolysis, further depleting
energy reserves and exacerbating protein deficiency. These metabolic
derangements underline the critical role of nutritional interventions
in mitigating complications and improving outcomes in CLD [15,16].
Given these complexities, nutritional management in CLD
patients has gained increasing importance, particularly with the rise
in hepatic transplantation as a definitive treatment for end-stage liver
disease. Malnutrition significantly impacts transplantation outcomes,
with pre-transplant nutritional deficits linked to increased operative
complications, prolonged hospital stays, and higher postoperative
mortality rates. Thus, addressing malnutrition is not only essential
for enhancing survival rates but also for optimizing transplantation
success [17,18].
This study aims to provide a comprehensive assessment of
nutritional status in CLD patients using an array of methodologies,
including anthropometric measurements, functional assessments,
and biochemical evaluations. It further seeks to elucidate the
relationship between malnutrition and the severity of CLD, offering
valuable insights into targeted interventions. By addressing these
critical aspects, this research endeavors to contribute to improved
clinical management and outcomes for patients suffering from
chronic liver disease.
Materials and Methods
The study was conducted in the Department of General
Medicine at B.R. Singh Hospital and Centre for Medical Education
and Research, Eastern Railway, Sealdah, Kolkata. It included both
outpatient department (OPD) patients and indoor admissions. The
study employed a single-center, cross-sectional observational design
and was carried out from January 2021 to June 2022. Cohort flowchart
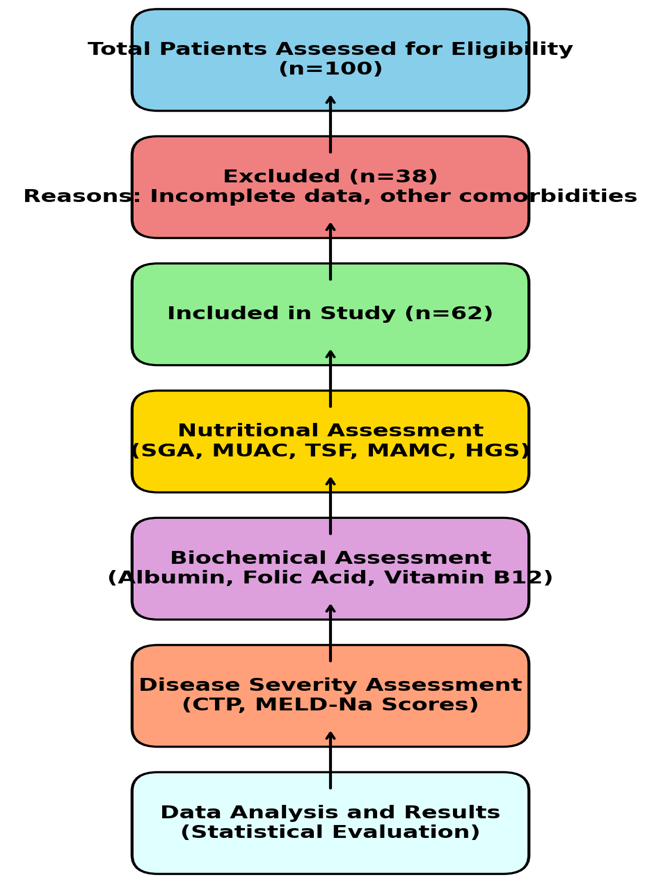
[Figure 1] representing the study process:
This flowchart illustrates the inclusion process of patients in the
study, starting with 100 assessed patients, exclusions due to incomplete
data or comorbidities, and the final cohort of 62 patients undergoing
nutritional, biochemical, and disease severity assessments.
Sample Size and Justification:
The sample size was calculated using the Epi Info software (version
7.2.2.2), a tool developed by the Centers for Disease Control and
Prevention (CDC). Based on findings by Sherpa et al., the prevalence
of malnutrition in chronic liver disease (CLD), determined by midarm
muscle circumference (MAMC) below the 5th percentile, was
estimated to be 74% (p = 0.74). Using a significance level of 5%, a
power of 85%, and accounting for a 15% loss of data, the required
sample size was determined to be 62 participants. The calculation
followed the formulan=4 pq
L
where q=1−p and L represents the loss percentage. Accordingly, a
sample size of 62 participants was selected.
Study Population:
Patients were selected randomly from the gastroenterology
outpatient department and inpatients admitted to the general
medicine ward. Randomization was performed using a random
number table. Data were systematically recorded in a pre-designed
proforma.Inclusion Criteria:
• Adult patients (both male and female) diagnosed with CLD
attending the gastroenterology OPD or admitted to the
general medicine department.
• Diagnosis was based on clinical symptoms (e.g., jaundice,
ascites, gastrointestinal bleeding), laboratory results (e.g., liver
function tests, HBsAg, Anti-HCV, autoimmune profiles), and
imaging findings (e.g., coarse echotexture, nodule formation,
portal vein dilatation).Exclusion Criteria:
1. Patients with other causes of malnutrition.
2. Those with hepatic encephalopathy or in a comatose state.
3. Patients on corticosteroid therapy.
4. Individuals with specific endocrinopathies, such as Grave’s
disease or Cushing’s syndrome.
5. Patients with sepsis, suspected hepatocellular carcinoma, or
other malignancies.
6. Those with chronic diarrhea or renal failure.
7. Patients suffering from chronic debilitating diseases, such as
tuberculosis or diabetes mellitus.Data Collection and Methodology
Hospital ethical committee approval was obtained prior to study
initiation, and informed consent was secured from all participants.
Detailed medical histories, physical examinations, and relevant
investigations were conducted for all patients.
1. Anthropometric Measurements:
o Measurements followed the guidelines of the International
Society for the Advancement of Kinanthropometry
(ISAK).
o BMI: Calculated as weight (kg)/height (m²).
o MUAC: Measured at the midpoint between the olecranon
and acromion process.
o TSF: Measured using a skinfold caliper on the posterior
aspect of the arm.
2. Functional Assessment:
o Handgrip Strength (HGS): Measured using a hydraulic
dynamometer. Sarcopenia was defined as HGS <28 kg for
men and <18 kg for women.
3. Nutritional Assessment:
o Subjective Global Assessment (SGA): Patients were
categorized into well-nourished (SGA-A), moderately
malnourished (SGA-B), or severely malnourished
(SGA-C).
o Royal Free Hospital Nutrition Prioritizing Tool (RFHNPT):
Classified patients as malnourished (scores 2-7) or
not at risk (score 1).
o Mini-Nutritional Assessment (MNA): Evaluated changes
in dietary intake, weight loss, psychological stress, and
neuropsychological status to classify patients as normal,
at risk, or malnourished.
4. Liver Disease Severity:
o Severity was assessed using the Child-Turcotte-Pugh
(CTP) score and MELD score, incorporating clinical and
laboratory parameters.
5. Laboratory Investigations:
o Complete blood count (CBC), bilirubin, albumin,
prothrombin time (PT), INR, serum urea, and creatinine.
o Vitamin B12 and folic acid levels were measured using
standard laboratory methods.
6. Radiological and Endoscopic Evaluations:
o Ultrasound and endoscopy were used to identify signs of
portal hypertension and varices.
Statistical analysis:
Data analysis was conducted using Epi Info (version 7.2.2.2).
Descriptive statistics calculated means and standard deviations.
The chi-square test was used for categorical variables, while t-tests
compared means between groups. Statistical significance was set
at p<0.05p<0.05p<0.05. Receiver operating characteristic (ROC)
curves were generated to assess the predictive power of nutritional
assessment tools based on the area under the curve (AUC).Result
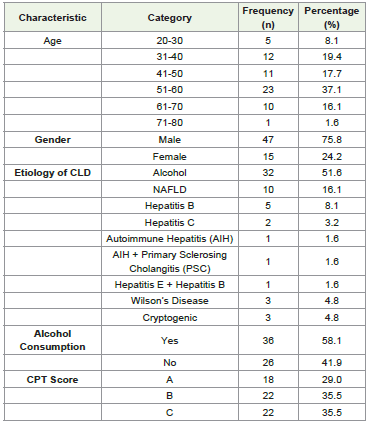
[Table 1] Demographic details, etiological factors, alcohol
consumption, and disease severity scores for chronic liver disease
patients in the study. This table1 summarizes the demographic
and clinical characteristics of the study population (n=62). Age
distribution shows the majority of participants were aged 51–60 years
(37.1%), with a smaller representation in the younger (20–30 years,
8.1%) and older (71–80 years, 1.6%) age groups. Males predominated,
accounting for 75.8% of the population. Alcohol was the most
common etiology of chronic liver disease (51.6%), followed by nonalcoholic
fatty liver disease (16.1%) and viral hepatitis. Notably,
58.1% of patients reported alcohol consumption. Based on the Child-
Turcotte-Pugh (CPT) scoring system, 29% of patients were classified
as grade A, while 35.5% each were in grades B and C, indicating
significant disease severity in a substantial portion of the cohort.
[Table 2] presents the clinical and nutritional assessment of the
study population (n=62). The majority of patients had a MELD-Na
score in the range of 10–19 (50.0%), followed by 20–29 (41.9%),
with a smaller proportion scoring 30–39 (8.1%), indicating varying
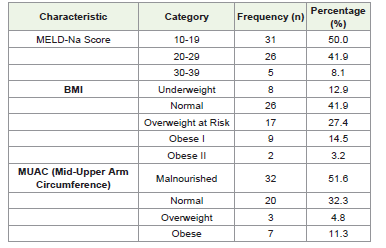
severities of liver dysfunction. Nutritional assessment using BMI
showed that 12.9% were underweight, 41.9% had a normal BMI, while
27.4% were classified as overweight at risk, and 17.7% were obese
(Obese I and II combined). MUAC assessment revealed malnutrition
in 51.6% of patients, normal nutritional status in 32.3%, and obesity
in 11.3%, highlighting a significant prevalence of malnutrition among
the cohort.
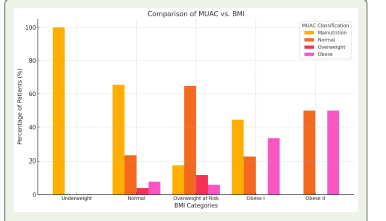
[Figure 2] compares MUAC classifications with BMI categories.
Patients with underweight BMI were predominantly malnourished
by MUAC, while variability was observed in normal BMI patients.
Overweight and obese BMI categories also showed no table
malnutrition, emphasizing the need for multimodal nutritional
assessment in chronic liver disease patients.
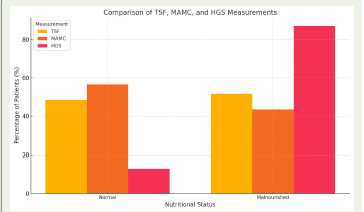
[Figure 3] compares Triceps Skinfold Thickness (TSF), Mid-Arm
Muscle Circumference (MAMC), and Handgrip Strength (HGS)
across normal and malnourished patients. While TSF and MAMC
values are higher in the normal group, HGS shows a significant
drop in malnourished patients, indicating its reliability in detecting
malnutrition. These findings emphasize the utility of multiple
parameters in nutritional assessment.
[Figure 4] shows the distribution of patients based on their folic
acid levels. A larger proportion of patients (n=36) had low folic acid
levels compared to those with normal levels (n=26), highlighting a
significant prevalence of folic acid deficiency in the study population.
[Table 3] summarizes the prevalence and distribution of sarcopenia,
nutritional assessments, and biochemical parameters among chronic
liver disease (CLD) patients.
• Sarcopenia: Present in 72.6% of patients, with significantly
lower Handgrip Strength (HGS: 17.3 ± 5.1 kg) compared to
non-sarcopenic patients (30.6 ± 6.2 kg; p<0.0001).
• Subjective Global Assessment (SGA): Most patients were
moderately malnourished (SGA B, 67.7%), with a mean
albumin level of 3.05 ± 0.58 g/dL. Severely malnourished
patients (SGA C, 14.5%) had the lowest albumin levels (2.40
± 0.36 g/dL), showing significant malnutrition severity
(p<0.0001).

• RFH-NPT (Royal Free Hospital Nutritional Prioritizing
Tool): High nutritional risk was observed in 72.6% of patients,
with a mean BMI of 21.1 ± 2.9 kg/m², while patients with no
risk had the highest BMI (26.9 ± 3.1 kg/m²; p<0.0001).
• Mini-Nutritional Assessment (MNA): Nearly half the
patients (48.4%) were malnourished with a mean albumin
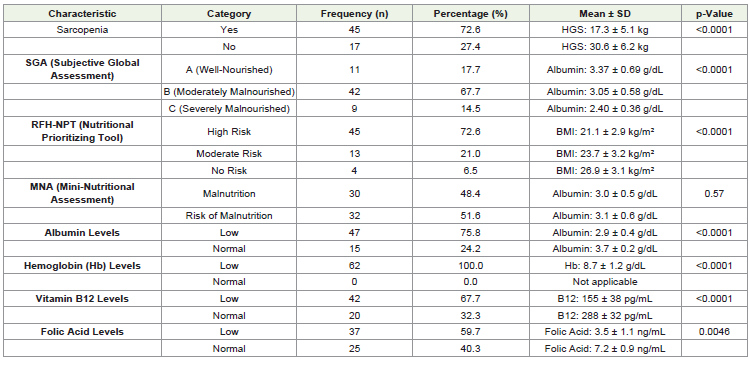
level of 3.0 ± 0.5 g/dL. No significant difference in albumin
levels was observed between malnourished patients and those
at risk (p=0.57).
• Biochemical Parameters:
o Albumin Levels: Low in 75.8% of patients (mean: 2.9 ±
0.4 g/dL), significantly lower than normal albumin levels
(3.7 ± 0.2 g/dL; p<0.0001).
o Hemoglobin Levels: All patients had low hemoglobin
(mean: 8.7 ± 1.2 g/dL; p<0.0001).
o Vitamin B12 Levels: Deficiency was noted in 67.7% of
patients, with significantly lower levels (155 ± 38 pg/mL)
compared to those with normal levels (288 ± 32 pg/mL;
p<0.0001).
o Folic Acid Levels: Low in 59.7% of patients, with a mean
level of 3.5 ± 1.1 ng/mL, significantly lower than the
normal range (7.2 ± 0.9 ng/mL; p=0.0046).
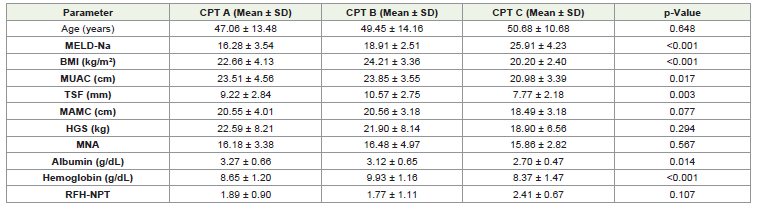
[Table 4] Shows, MELD-Na: Significantly higher in patients with
advanced disease (CPT C). BMI and MUAC: Decrease as CPT scores
increase, indicating worsening nutritional status.TSF: Lower in CPT
C, reflecting higher fat depletion in advanced disease.Albumin and
Hb: Lower in CPT C, showing more severe hypoalbuminemia and
anemia in advanced liver disease.MAMC, HGS, and MNA: Show no
significant difference but trend lower in advanced stages.
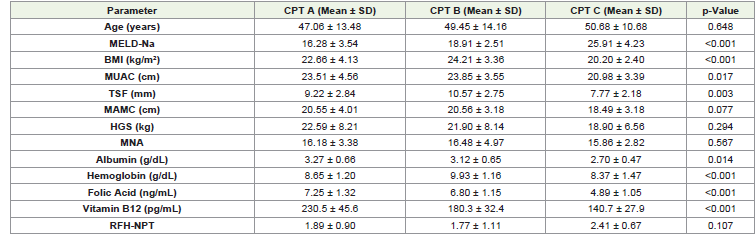
[Table 5] Compares clinical, nutritional, and biochemical
parameters across CPT score categories (A, B, and C).
1. Significant Findings: MELD-Na, BMI, MUAC, TSF,
albumin, hemoglobin, folic acid, and vitamin B12 levels decline
significantly with worsening CPT scores, indicating progressive liver
dysfunction and nutritional deterioration.
2. Non-Significant Findings: Age, MAMC, HGS, MNA, and
RFH-NPT show no significant differences but suggest worsening
trends in advanced disease stages.
The [Table 6] analysis of nutritional and functional assessments
across Subjective Global Assessment (SGA) categories (A:
Well-nourished, B: Moderately malnourished, and C: Severely
malnourished) highlights significant trends in malnutrition
and sarcopenia. Malnutrition, as assessed by Mid-Upper Arm
Circumference (MUAC), was significantly higher in SGA B (68.75%)
and SGA C (28.13%) compared to SGA A (3.13%), reflecting greater
muscle wasting in patients with advanced SGA severity (p<0.001).
Triceps Skinfold Thickness (TSF) values showed higher rates of
adipopenia in SGA B (78.13%) and SGA C (18.75%), while SGA
A had predominantly normal TSF values (33.33%), confirming
significant fat loss with advancing malnutrition (p=0.007). Similarly,
Mid-Arm Muscle Circumference (MAMC) revealed severe muscle
depletion in SGA C (29.63% malnourished) and SGA B (66.67%
malnourished), with only 3.7% of malnourished cases in SGA
A, indicating progressive muscle wasting (p=0.002). Sarcopenia,
assessed separately, was observed in 93.33% of SGA B and 100%
of SGA C patients, while only 6.67% of SGA A patients exhibited
muscle loss, further highlighting the correlation between SGA
severity and sarcopenia (p<0.001). Handgrip Strength (HGS), a
functional marker, demonstrated significant declines with increasing
SGA severity. Normal HGS was primarily seen in SGA A (50%) and
B (50%), but none of the SGA C patients had normal functional
strength. Conversely, malnourishment by HGS was highest in SGA B
(70.37%) and SGA C (16.67%), with fewer cases in SGA A (12.96%),
reflecting a significant loss of functional capacity as malnutrition
worsened (p=0.028). The Royal Free Hospital Nutritional Prioritizing
Tool (RFH-NPT) further identified high nutritional risk in 77.78% of
SGA B and 20% of SGA C patients, with all SGA A patients classified
as either low or moderate risk. High nutritional risk in SGA B and
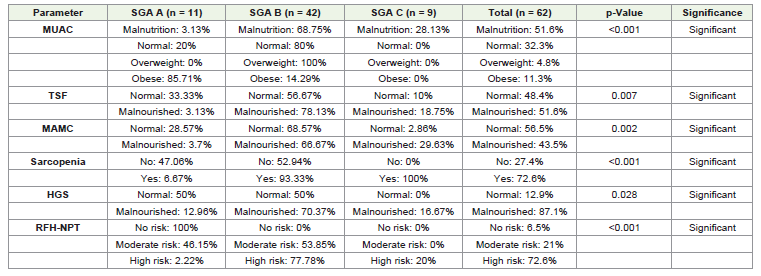
C groups underscores the escalating burden of malnutrition and
associated complications in advanced SGA categories (p<0.001).
[Table 7] Highlights the significant differences in clinical,
nutritional, and functional parameters across SGA categories. The
progression from SGA A to SGA B&C shows a clear deterioration
in liver function, body composition, and overall nutritional status,
underscoring the impact of advanced malnutrition and liver disease.
These findings emphasize the need for early nutritional interventions
to improve outcomes in patients with moderate to severe malnutrition.
Let me know if you need further clarifications!
1. Significant Parameters:
o MELD-Na: Increased significantly from SGA A (16.64)
to SGA B&C (21.49), indicating worsening liver disease
severity.

o BMI, MUAC, TSF, MAMC: All showed significant
declines from SGA A to SGA B&C, reflecting progressive
malnutrition and body composition changes.
o HGS: A marked reduction in handgrip strength was
noted in SGA B&C (18.98) compared to SGA A (30.56),
indicating reduced functional capacity.
o RFH-NPT: Higher scores in SGA B&C indicate a greater
risk of nutritional complications.
o Albumin: Levels decreased significantly from SGA A
(3.37) to SGA B&C (2.94), reflecting worsening liver
synthetic function and malnutrition.
2. Non-Significant Parameters:
o Age: No significant difference was observed among the
groups.
o MNA and Hemoglobin: Despite a trend toward
worsening nutritional scores and anemia in SGA B&C,
the differences were not statistically significant.
[Table 8] discuss following
1. Age: Alcoholic patients were slightly older on average (51.56
± 9.09 years) compared to non-alcoholic patients (45.92 ±
16.07 years), but this difference was not statistically significant
(p=0.121).
2. MELD-Na: Although alcoholic patients had a higher mean
MELD-Na score (21.78 ± 5.34) compared to non-alcoholic
patients (19.04 ± 5.02), this difference was not statistically
significant (p=0.058). However, the trend suggests that
alcoholic patients may have more severe liver dysfunction.
3. BMI (Body Mass Index): Alcoholic patients had a lower
BMI (21.69 ± 3.57 kg/m²) compared to non-alcoholic
patients (23.24 ± 3.72 kg/m²), indicating greater nutritional
compromise in alcoholics. However, this difference was not
statistically significant (p=0.113).
4. MUAC (Mid-Upper Arm Circumference): MUAC values
were slightly lower in alcoholic patients (22.54 ± 3.84 cm)
than in non-alcoholic patients (23.00 ± 4.22 cm), but the
difference was not significant (p=0.338).
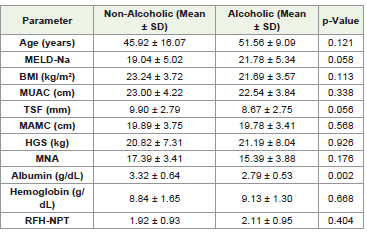
5. TSF (Triceps Skinfold Thickness): Alcoholic patients showed
a trend toward lower TSF (8.67 ± 2.75 mm) compared to
non-alcoholic patients (9.90 ± 2.79 mm), reflecting possible
adipose tissue loss. However, the difference did not reach
statistical significance (p=0.056).
6. MAMC (Mid-Arm Muscle Circumference): MAMC values
were almost identical between alcoholic (19.78 ± 3.41 cm) and
non-alcoholic (19.89 ± 3.75 cm) patients, with no significant
difference (p=0.568).
7. HGS (Handgrip Strength): Handgrip strength was slightly
higher in alcoholic patients (21.19 ± 8.04 kg) compared to
non-alcoholic patients (20.82 ± 7.31 kg), but this difference
was not statistically significant (p=0.926).
8. MNA (Mini-Nutritional Assessment): MNA scores were
lower in alcoholic patients (15.39 ± 3.88) compared to nonalcoholic
patients (17.39 ± 3.41), suggesting worse nutritional
status in alcoholics, but the difference was not statistically
significant (p=0.176).
9. Albumin: Alcoholic patients had significantly lower albumin
levels (2.79 ± 0.53 g/dL) compared to non-alcoholic patients
(3.32 ± 0.64 g/dL), with this difference being statistically
significant (p=0.002). This indicates poorer liver synthetic
function and more severe malnutrition in alcoholic patients.
10. Hemoglobin: Mean hemoglobin levels were slightly higher
in alcoholic patients (9.13 ± 1.30 g/dL) than in non-alcoholic
patients (8.84 ± 1.65 g/dL), but this difference was not
statistically significant (p=0.668).
11. RFH-NPT (Royal Free Hospital Nutritional Prioritizing
Tool): Alcoholic patients had slightly higher RFH-NPT
scores (2.11 ± 0.95) than non-alcoholic patients (1.92 ± 0.93),
but the difference was not significant (p=0.404).
(a) Sarcopenia Prevalence in Alcoholic vs. Non-Alcoholic CLD
Patients:This graph illustrates the higher prevalence of sarcopenia
in alcoholic patients compared to non-alcoholic patients. Among
alcoholic patients, 83.3% had sarcopenia, whereas only 53.8% of
non-alcoholic patients exhibited sarcopenia. The results highlight
the significant impact of alcohol consumption on muscle wasting in
chronic liver disease (CLD) patients.
(b) Folic Acid Levels in Alcoholic vs. Non-Alcoholic CLD
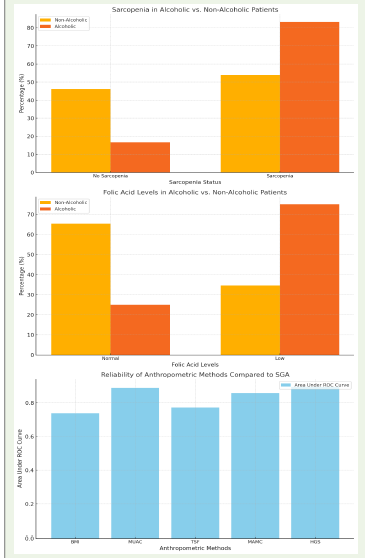
Patients: This graph compares folic acid levels between alcoholic and
non-alcoholic CLD patients. Ahigher proportion of alcoholic patients
(75%) had low folic acid levels compared to non-alcoholic patients
(34.6%). The findings underscore the adverse effects of alcohol on
micronutrient deficiencies, particularly folic acid, in CLD patients.
(c) Reliability of Anthropometric Methods Compared to
SGA: This graph compares the reliability of various anthropometric
methods in diagnosing malnutrition, using the Subjective Global
Assessment (SGA) as the reference standard. Handgrip Strength
(HGS) showed the highest Area Under the Curve (AUC = 0.895),
followed by Mid-Upper Arm Circumference (MUAC), Mid-Arm
Muscle Circumference (MAMC), and Triceps Skinfold Thickness
(TSF). Body Mass Index (BMI) demonstrated the lowest reliability
(AUC = 0.738). These results establish HGS as the most effective
anthropometric tool for nutritional assessment in CLD patients.
Discussion
This hospital-based prospective observational study evaluated
the nutritional status of chronic liver disease (CLD) patients,
focusing on its severity and etiology. A total of 62 patients were
included, with the majority (54.8%) aged between 40 and 60 years,
a demographic pattern aligning with prior studies, such as that by
Mukherjee et al., which also reported a median age of 43 years. The
current study observed a notable male predominance (75.8%), with a
male-to-female ratio of 3.1:1, comparable to earlier findings in India.
However, a significant proportion (19.4%) of the patients were in the
30-40 age group, suggesting an alarming trend of earlier disease onset
and increased healthcare burden(19,20).
Etiological Patterns and Disease Severity:
Alcoholic liver disease (ALD) was identified as the leading
cause of CLD (51.6%), followed by non-alcoholic fatty liver disease
(NAFLD, 16.1%), while hepatitis B and C together accounted for only
12.9%. These findings are consistent with a nationwide transition
in CLD etiology, where alcohol abuse and NAFLD are replacing
viral causes, as highlighted in studies by Mukherjee et al., Sarin et
al., and Anand et al. The rising incidence of NAFLD in the current
study aligns with increasing BMI and diabetes prevalence, reflecting a
broader epidemiological shift in India [21,22,23].In alignment with findings by Nunes et al., this study demonstrated
that alcoholic patients exhibited greater disease severity. A significantly
higher proportion of alcoholic patients fell into Child-Turcotte-Pugh
(CTP) grade B or C categories, with correspondingly elevated MELDNa
scores, underscoring their worsened liver function. Furthermore,
the study by Ciocirlan et al. corroborated the distribution of CTP
scores observed here (A: 29%, B: 35.5%, C: 35.5%), indicating a high
burden of decompensated CLD in both cohorts[24,25].
Malnutrition and Sarcopenia in CLD:
The prevalence of malnutrition in CLD patients was assessed using
various tools. Subjective Global Assessment (SGA) identified high risk
(67.7%) and severe malnutrition (14.5%), findings consistent with
Aguila et al., who reported similar associations between malnutrition
and higher CTP and MELD-Na scores. Notably, malnutrition severity
significantly correlated with SGA categories, with higher SGA scores
reflecting worse nutritional outcomes[26,27].Anthropometric measurements revealed malnutrition in a
significant proportion of patients: 51.6% by TSF and 43.5% by
MAMC. These results closely align with Sherpa et al. and Campillo
et al., who also reported high malnutrition rates in advanced CLD
patients[28,29,30]. Interestingly, the current study found BMI less
predictive of nutritional status due to confounding factors such as
ascites and fluid retention, echoing findings by De Mattos et al.
Sarcopenia, a critical manifestation of malnutrition in CLD,
was identified in 72.6% of patients, significantly higher in alcoholic
patients (83.33%) compared to non-alcoholic patients (53.85%).
These findings support prior studies by Dasarathy et al. and Kumar
et al., which highlighted alcohol’s deleterious effects on muscle mass
and metabolism. The strong association between SGA categories and
sarcopenia further validates the reliability of SGA as a malnutrition
assessment tool [31].
Folic Acid and Nutritional Assessment Reliability:
Alcoholic patients had significantly lower folic acid levels
(75% deficient) compared to non-alcoholic patients (34.62%),
corroborating studies by Nunes et al. This deficiency reflects a higher
malnutrition risk in ALD. Among the anthropometric methods
evaluated, handgrip strength (HGS) emerged as the most reliable
tool for detecting malnutrition (AUC: 0.895), outperforming MUAC,
MAMC, and TSF. This finding aligns with studies by Magdy et al. and
Johnson et al., which also endorsed HGS for its predictive value in
cirrhosis complications [34,35].Strengths of the Study:
1. One of the few Indian studies addressing malnutrition in
CLD comprehensively.
2. Adequate sample size ensuring robust statistical conclusions.
3. Conducted in a tertiary referral hospital, reflecting the
broader Eastern Indian population.
4. Adherence to ESPEN 2006 guidelines with standardized
anthropometric and biochemical assessments.
Limitations of the Study
1. A larger sample size might yield more definitive results.
2. The cross-sectional design precluded longitudinal analysis of
treatment outcomes.
3. Advanced diagnostic tools like CT SMI, DEXA, and BIA
scans were not employed to detect sarcopenia.Conclusion
Malnutrition is a pervasive complication in chronic liver
disease (CLD) and worsens with disease severity. CLD patients
commonly experience not only protein-calorie malnutrition but also
adipopenia, sarcopenia, muscle wasting, frailty, and micronutrient
deficiencies. Malnutrition serves as an independent predictor of
mortality and complications in CLD, highlighting the critical need
for comprehensive nutritional screening, even in early stages of the
disease.
Anthropometric and questionnaire-based assessment methods
reliably estimate the severity of malnutrition. In this study, Subjective
Global Assessment (SGA), Royal Free Hospital Nutritional Prioritizing
Tool (RFH-NPT), Handgrip Strength (HGS), and Mid-Arm Muscle
Circumference (MAMC) were found to be reliable, reproducible, and
effective tools for assessing malnutrition. The findings also underscore
the detrimental role of alcohol as an etiological factor, significantly
exacerbating malnutrition. Even obese alcoholic patients, as classified
by BMI, were found to have underlying sarcopenia, contributing to
increased complications and mortality.
The present study emphasizes the urgent need to prioritize
nutritional assessment in CLD patients. Early detection and
management of malnutrition can significantly improve prognosis
and clinical outcomes. Increased awareness among clinicians and the
integration of nutritional assessments into routine CLD management
protocols will pave the way for better care and outcomes in this
vulnerable patient population.
References
Citation
Hait A. Nutritional Status Assessment in Chronic Liver Disease Patients According to Severity and Etiology. Indian J Nutri. 2025;12(1): 307.