Case Report
Comparative Analysis of CORADS Score on HRCT Chest and RT-PCR Swab Test Outcomes in Suspected COVID-19 Cases – A Cross-Sectional Study
Mehta R1 and Bagada A2*
1Chairman and Head of Department of Imaging Sciences, Saifee Hospital, Mumbai, India.
2Ex-Resident, Department of Radiology, Saifee Hospital, Mumbai, India.
2Ex-Resident, Department of Radiology, Saifee Hospital, Mumbai, India.
*Corresponding author:Archana Bagada, Department of Imaging sciences, Saifee Hospital, Mumbai, India. E-Mail Id: drarchie93@gmail.com
Copyright: © 2025 Mehta R, et al. This is an open access article distributed under the Creative Commons Attribution License, which permits unrestricted use, distribution, and reproduction in any medium, provided the original work is
properly cited.
Article Information: Submission: 15/12/2024; Accepted: 17/01/2025; Published: 22/01/2025
Abstract
Background: The COVID- 19 pandemic has brought about significant challenges in the healthcare industry, with a primary focus
on identifying and diagnosing cases of SARS- CoV- 2 infection. The reverse transcription-polymerase chain reaction (RT-PCR) test is regarded as the definitive method for diagnosing COVID-19. High resolution computed tomography (HRCT) examination plays an important role because of its high sensitivity. Our study was planned to evaluate the Covid 19 reporting and data system (CORADS) scoring classification system for reporting COVID-19 pneumonia and to assess the correlation between HRCT findings and RTPCR test.
Methodology: A single centre, hospital based, cross-sectional, observational study was conducted from 1st July 2020 to 30th June 2020 and a total of 200 patients were included in the study.
Results: 86 cases (43%) were seen between 61- 80 years of age group, 70% (141) were male, 85% patients were symptomatic for COVID-19. 92% had ground glass opacities and 48% had crazy paving and were significantly associated with RTPCR (P- value <0.001). CORADS 1, CORADS 2, CORADS 3, CORADS 5, CORADS 6 were significantly associated (P- value <0.001) with RTPCR whereas CORADS 4 did not show any significant association with RTPCR in our study.
Conclusions: Our study demonstrates a significant correlation between CORADS scores and RT-PCR results in diagnosing COVID-19, particularly for CORADS categories 1, 2, 3, 5, and 6, which showed strong associations with RT-PCR outcomes. The high prevalence of ground-glass opacities and crazy paving patterns in CT findings further underscores the role of HRCT in detecting COVID-19 pneumonia. These findings suggest that the CORADS classification can serve as a valuable diagnostic tool, especially in settings with limited RT-PCR accessibility, to support early and accurate diagnosis of COVID-19, facilitating timely patient management and resource allocation.
Keywords:COVID-19; CORADS; RT-PCR
Introduction
In late December 2019, Wuhan, China, became the center of
an outbreak of pneumonia caused by a novel coronavirus, which
was newly named severe acute respiratory syndrome coronavirus 2
(SARS-CoV-2). More and more cases of SARS-CoV-2 pneumonia
were reported worldwide causing a global concern.[1] COVID 19
outbreak was declared as a Public Health Emergency of International
Concern (PHEIC) on 30 January 2020 and a pandemic on 11th March
2020 by the WHO Director General.[2] The COVID- 19 pandemic
has brought about significant challenges in the healthcare industry,
with a primary focus on identifying and diagnosing cases of SARSCoV-
2 infection. Early diagnosis of COVID-19 is crucial for the
isolation of patients and prevention of the spread of infection, as well
as early patient intervention.
The reverse transcription-polymerase chain reaction (RTPCR)
assay is considered the most accurate method for diagnosing
COVID-19. However, its sensitivity is variable as it depends on the
duration of symptoms, viral load, the rate of viral replication in the
upper respiratory tract, and quality of the The test sample has a pooled
sensitivity reported at 64.8% (95% confidence interval (CI) 54.5–74.0)
in clinical settings.
Computed tomography (CT) imaging is crucial in diagnosing
COVID-19 in epidemic regions due to its high sensitivity. It has been
reported that patients with negative RT-PCR results may have positive
chest CT findings, and combining RT-PCR with CT scans is expected
to improve the diagnosis of COVID-19. Multiple CT imaging features
characteristic of COVID-19 pneumonia have been documented, with
the most common findings being bilateral, peripheral or subpleural,
and posterior ground-glass opacities, sometimes accompanied by
consolidations. To streamline reporting, the Dutch Radiological
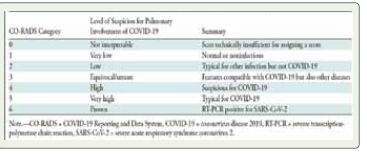
Society developed the COVID-19 Reporting and Data System (CORADS),
which uses a standardized five-point scale to indicate the level
of suspicion for COVID-19 pneumonia in chest CT images. [4]
The COVID-19 Reporting and Data System (CORADS) is a
structured assessment tool for chest CT scans in patients suspected
of COVID-19, indicating the likelihood of lung involvement. Score
ranges from 0 to 6. Its strong interobserver agreement and high
discriminatory value make it highly suitable for clinical use. Chest CT
has been suggested to possess the potential to diagnose COVID-19
with significant sensitivity, and even screen asymptomatic patients.
[5]
The CO-RADS classification, established by the Dutch Radiological
Society, serves as a standardized system for reporting suspected
COVID-19 cases, particularly in moderate to high prevalence
settings. The system assesses the probability of COVID-19 infection
using CT scan findings, with classifications ranging from CO-RADS 1
(indicating very low suspicion) to CO-RADS 5 (indicating very high
suspicion) [4] [Table 1] . Additionally, it evaluates the severity and stage
of the disease while addressing potential comorbidities and providing
a differential diagnosis. CORADS helps in easier communication with
referring physician, thus helping better patient care.
Below are the images assigned to cases with varying CORADS
(COVID-19 Reporting and Data System) scores, categorized
based on the imaging findings and their probability of COVID-19
involvement:
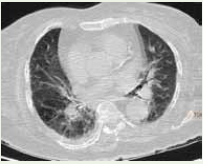
CORADS 0
Scan insufficient for assigning score [Figure 1]
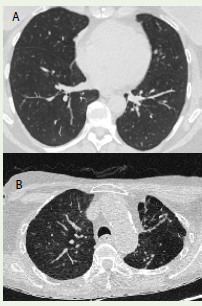
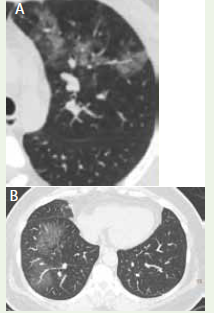
CORADS-1 (Very Low Suspicion): Normal chest imaging or findings unrelated to infection, such as mild emphysema or bronchiectasis, fibrotic bands [Figure 2A] and [Figure 2B]
Scan insufficient for assigning score [Figure 1]
CORADS-1 (Very Low Suspicion): Normal chest imaging or findings unrelated to infection, such as mild emphysema or bronchiectasis, fibrotic bands [Figure 2A] and [Figure 2B]
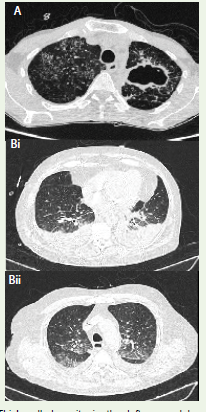
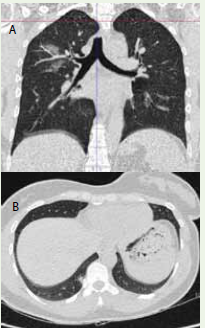
CORADS-2 (Low Suspicion): Abnormalities consistent with
other infections like tuberculosis with tree-in-bud centrilobular
nodules and cavitatory consolidation or pleural effusion with
cardiomegaly, multiple hilar ground glass opacities with septal
thickening. [Figure 3A] and [Figure 3B]
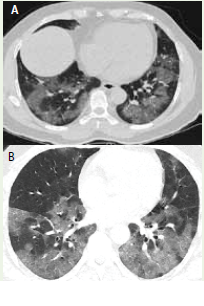
CORADS 3 (Equivocal): The findings here are indeterminate/ atypical, thus unsure of
COVID 19 involvement. CT abnormalities seen in CORADS 3
are diffuse or perihilar, unifocal unilateral GGO, apical or central
distribution, lack of specific distribution. The features indicate
infection but unsure whether COVID 19 is involved.[Figure 4A] and
[Figure 4B]
CORADS 4 (High Suspicion): Here the level of suspicion for COVID19 infection is high. Mostly
these are suspicious CT findings but not extremely typical such as
unilateral multiple ground glass, multifocal consolidations without
any other typical finding, preexisting/ coexistant pulmonary disease.
[Figure 5]
CORADS 5: The findings here are typical of COVID 19. The CT findings
include ground glass opacities, consolidations, bilateral (can be
unilateral in early cases), peripheral, basal predominance, rounded/
nodular upto 50% cases, organizing pneumonia, atoll/ reverse halo
sign, perilobular distribution.[Figure 6]
CORADS 6
Patient with positive RTPCR test.
The local data on comparison of CORADS score and RTPCR
results in diagnosis of coronavirus disease is scarce in literature.[6]
This proposed system has not been extensively evaluated yet to our
knowledge. Therefore, the purpose of our study is to evaluate the
CORADS scoring classification system for reporting COVID-19
pneumonia and to assess the correlation between HRCT findings and
RTPCR test.
Methodology
A single centre, hospital based, cross-sectional, observational
study was conducted by Department of Radiodiagnosis, Saifee
hospital, Mumbai from 1st July 2020 to 30th June 2021. This study was
conducted in compliance with ethical standards, and all necessary
approvals were obtained from the institutional review board. Patients
of all age groups irrespective of gender referred to CT Department for
suspected COVID19 infection by the treating physician/surgeon were
included in the study. Patients who did not give consent, follow up
patients, patients without RT-PCR tests and uncooperative patients
were excluded from the study. Sample size was obtained as 196 at a
confidence interval of 95%, power of the study being 80%, absolute
precision as 5% and considering an adjusted seroprevalence of 15% as
per a study by Malani et al (2021).[7]
Convenient sampling i.e., every consecutive patient fulfilling
inclusion and exclusion criteria, giving informed and written consent
were enrolled to complete the sample size in the stipulated duration.
Patient/Guardians were offered informed consent form, and after
consent, the data was filled including information regarding biodata,
symptoms, relevant examination findings and lab tests.
Data collection technique
➢ Requisition form requesting for HRCT chest.
➢ Detailed clinical history along with clinical examination findings was recorded.
➢ The procedure was explained to patient in detail and informed, written and valid consent as per the proforma was taken.
➢ Patient was evaluated with help of CT machine by multiplanar acquisition of images.
➢ CT machine used was Philips Brilliance iCT 256 slice volume scanners.
At the end of study, patients were divided into groups based upon
CORADS scoring, imaging features, RT-PCR results, CT severity
score and relevant statistical tests performed for possible correlation
with baseline features.
The data was entered into the Microsoft excel for analysis from
the customized proforma Descriptive statistics was evaluated using
numbers and percentages. Data was presented as tables, bar diagrams
and pie charts. For continuous variables, mean ± standard deviation
was given. Pearson’s chi square test and Fischer Exact test was used
to determine the P value. P value of < 0.05 was taken as statistically
significant.
Results
In the present study, out of 200 cases majority of them i.e., 86
cases (43%) were seen between 61- 80 years of age group, followed
by 71 cases (36%) in 41-60 years of age group, 27 cases (13%) in
21-40 years of age group,14 cases (7%) had age more than 80 years
and around 2 case (1%) had age less than 20 years. 70% (141) were
male and around 30% (59) were female. About 85% patients were
symptomatic and 15% were asymptomatic for COVID19, however
scan was advised to rule out COVID19 for preoperative evaluation
and pre-admission formalities. Most of the cases i.e., 58 cases (29%)
had no co-morbidities, 47 cases (24%) had DM with HTN, 46 cases
(23%) had HTN followed by 29 cases (15%) with only DM. In the
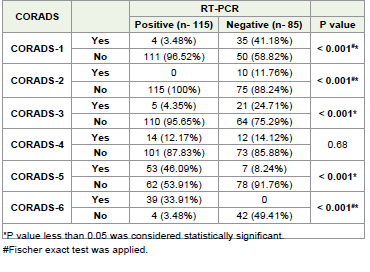
current study, out of 200 cases 60 cases (30%) had CORADS-5,
followed by 39 cases (19.5%) had CORADS-1 and CORADS-6 each,
26 cases (13%) had CORADS-3 & CORADS-4 each, and 10 cases
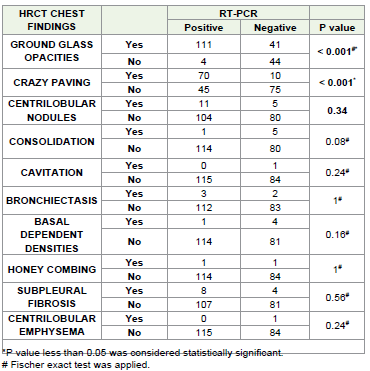
(5%) had CORADS-2 SCORE [Table 2] . Majority of the patients 111
(55.56%) who were RT-PCR positive had Ground glass opacities and
70 (35%) had crazy paving on HRCT. This association between RTPCR
and ground glass opacities on HRCT findings were found to be
statistically highly significant [Table 4] . In the current study, out of
total 39 CORADS-1 cases about 90% (35 cases) were RT-PCR negative
and 10% (4 cases) were RT-PCR positive, out of total 10 CORADS-2
cases all were RT-PCR negative i.e. 100% (10 cases), out of total 26
CORADS-3 cases about 81% (21 cases) were RT-PCR negative and
19% (5 cases) were RT-PCR positive, out of total 26 CORADS-4 cases
about 46% (12 cases) were RT-PCR negative and 54% (14 cases) were
RT-PCR positive, out of total 60 CORADS-5 cases about 12% (7
cases) were RT-PCR negative and 88% (53 cases) were RT-PC [Table 4] .
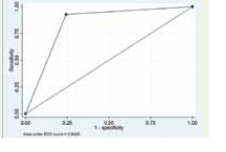
Sensitivity of the test was obtained as 92.86% and specificity as
75.71%, Area under curve (AUC) was obtained as 0.84 (95% CI 0.77-
0.89). This suggests an 84% chance that the radiologist reading the
image will correctly distinguish a normal from an abnormal patient
based on the ordering of the image ratings. Positive likelihood ratio
was obtained as 3.82 which means that patientwho have COVID- 19
have 3.8 times more chance to test positive on HRCT than patients
without COVID- 19 who also test positive. [Figure 7]
Discussion
High resolution Computed tomography (HRCT) of the chest
is increasingly recognized as strong evidence for early diagnosis,
because the changes in chest imaging sometimes may be earlier than
clinical symptoms and thus HRCT scan play an early warning role in
the diagnosis of COVID-19.[8]
Our study included 200 patients suspected of COVID 19 referred
by the physician to the department of radio diagnosis, Saifee Hospital,
Mumbai for HRCT thorax.
The mean age of the patients in our study was found to be 59.14 +
15.86 years with majority of patients belonging to the age group of 61-
80 years of age. This correlated with the findings of Tao Ai et al 2020
(mean age was 51 + 15 years and majority were above 40 years of age),
[9] Hanif et al 2020 (mean age was 46.54 + 15.22 years and majority
were in the age group 45-65 years), [6] Abdel-Tawab et al 2021 (mean
age was 45 + 16.9 years), [10] Alam et al 2020 (mean age 49.97 + 13.6
years and majority were in the age group 51-60 years). [11]
Male predominance with 70% male and only 30% female was
reported in our study. Similarly male predominance was also seen in
studies done by Hanif et al 2020,[6] Abdel-Tawab et al 2021,[10]
and Yan li et al2020 [12] and Sharma et al 2021 [13] whereas female
predominance in a study by Tao Ai et al 2020.[9]
About 85% patients had symptomatic clinical presentation and
only 15% were asymptomatic. This correlates with findings of Sharma
et al 2021 [13] which showed 91.22% were symptomatic and 8.78%
were asymptomatic. 57% were RTPCR positive and 43% were RTPCR
negative in our study which was similar to Tao Ai et al 2020 which
reported 59% as RTPCR positive and 41% RTPCR negative. [9] Alam
et al reported 96% RTPCR positive.[11]
Since the start of the outbreak, it has been seen that co-morbid
individuals had higher chance of acquiring COVID 19 infection. We
saw that around 24% patients had both DM with HTN, followed by
23% having only HTN, followed by 15% with only DM. About 29%
did not have any co-morbidities whereas rest 71% had some or the
other comorbid condition. Similar findings were also reported by
Islam et al (2020) where about 35% study participants were diabetic
and around 28.4% were hypertensive. [14]
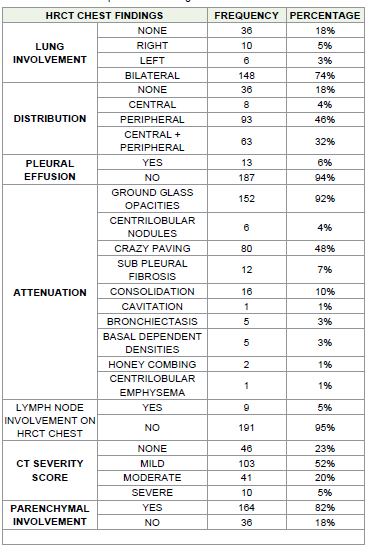
Out of 200 patients about 165 patients showed attenuation on
HRCT chest and among those about 92% had ground glass opacities,
48% had crazy paving, 10% had consolidation, 7% had subpleural
fibrosis, 4% had centrilobular nodules, and only 3% showing basal
dependent densities and bronchiectasis [Table 3] . Study by Hanif et
al 2020 reported ground glass opacity as the most frequent pattern on
CT findings with 92.3% which correlates with our findings. [6] Yan li
et al2020 reported ground glass opacity or consolidation or both in
96.1% patients, crazypaving was seen in 70.6% [12] Sharma et al 2021
had similar findings with ground glass opacity being most common
finding with 74.6%.[15] Their study also showed that 13.3% had
consolidation and 2.62% had bronchiectasis which were similar to our
findings. However, crazy paving was seen only in 1.32%.[13] Other
studies such as Tao Ai et al 2020 reported ground glass opacities in
46% and consolidations in 50%, [9] whereas Ishfaq et al 2021 reported
ground glass opacities in 71.64%, interlobular septal thickening in
43.28%, nodules in 14.84%[16] Alam et al 2020 reported 96% had
ground glass opacities, crazy paving was seen in 50.78%.[11]
Only 6% had pleural effusion and 5% had lymphadenopathy out
of 200 patients. This finding correlates with Ishfaq et al 2021 were
pleural effusion and lymphadenopathy was reported to be 5.08%
and 7.64% respectively.[16] Sharma et al 2021 reported 27.92%
lymphadenopathy. [13] Yan li et al2020 reported 2% pleural effusion.
[12]
Bilateral involvement of lung was seen in majority of patients i.e
74%. Hanif et al 2020 and Alam et al 2020 reported bilateral lung
involvement in 97.4% and 92.19% respectively.[6,11] Tao Ai et al
2020 also reported bilateral lung involvement in 90%. [9]
Lower lobe involvement was seen in majority patients with 90%
involving the RLL, followed by 87% involving LLL. Similar results
were shown by Alam et al 2020 where RLL was most commonly
involved with 93.75% followed by LLL involvement with 91.41%.[11]
CT severity score categorized as mild, moderate and severe
showed that majority of the patients had mild CTSS with 52%, 20%
had moderate CTSS and only 5% had severe CTSS. Alam et al 2020
reported 69% had 1-5 CTSS, followed by 25.78% had 6-10 CTSS, 11-
15 CTSS had 21.09%,16-20 CTSS had 19.53%.[11]
CORADS 1, CORADS 2, CORADS 3, CORADS 5, CORADS 6
were significantly associated with RTPCR whereas CORADS 4 did
not show any significant association with RTPCR in our study. Out
of total CORADS-1 cases about 90% were RT-PCR negative and 10%
are RT-PCR positive. Similarly, Hanif et al 2020 also reported 2.5%
patients with positive RTPCR had normal scan. The RTPCR positive
may be due to early conduction of HRCT chest or due to presence of
greater number of patients with moderate to severe cases. (6) Tao Ai et
al 2020 also reported 21 patients out of total 1014 study participants
had positive RTPCR results without any lesions on chest CT. [9]
Out of total 10 CORADS-2 cases all were RT-PCR negative i.e.,
100%; Out of total 26 CORADS-3 cases about 81% were RT-PCR
negative and 19% are RT-PCR positive; out of total 26 CORADS-4
cases about 46% are RT-PCR negative and 54% are RT-PCR positive;
out of total 60 CORADS-5 cases about 12% are RT-PCR negative and
88% are RT-PCR positive, out of total 39 CORADS-6 cases all 100%
are RT-PCR positive. Tao Ai et al 2020 had similar correlate with 308
patients out of 1014 suggestive of COVID 19 but their RTPCR was
negative. Of these 308 patients, 256 patients had bilateral lung lesions
consisting of GGO and consolidation at chest CT. [9]
ROC analysis confirmed the significant diagnostic power of CTCORADS
with AUC = 0.84 (95%CI 0.77-0.89) to predict COVID-19
positivity (Figure 1). D Smet K et al confirms this diagnostic power
with similar AUC of 0.891 (95%CI 0.868-0.911) on a larger cohort of
859 symptomatic patients with a prevalence of 41.7% SARS-CoV-2
infections, indicating robustness of the scoring system.[17]
The findings of this study reveal that use of HRCT chest with
CORADS can help in early diagnosis of COVID 19 patients and
thereby help in planning the management. The study observed that
ground glass opacities are the most common imagining finding
with peripheral distribution being more frequent. Also, lower lobe
predominance was much more compared to other lobes. In addition
to its diagnostic value, chest CT is evidently also useful to assess the
overall severity of pulmonary involvement (number of affected lobes
and residual amount of well-aerated functional tissue) in COVID-19,
and provides a direct view on the temporal evolution of SARSCoV-
2 infection as proxy for its immunological stage. Finally, chest
CT allows the detection of other medical conditions with similar
symptoms as COVID-19 such as bacterial pneumoniae, pleural
effusion, lung cancer, pneumothorax and cardiac failure. Our findings
indicate that chest CT should be utilized for COVID-19 screening,
thorough evaluation, and follow-up, particularly in high-prevalence
areas where there is a strong pretest probability of the disease.
Limitation:
The main limitation of our study is that it was conducted in the
pandemic phase of COVID- 19 infection, in a time frame with low
prevalence of other respiratory viral infections such as influenza that
can induce similar radiological abnormalities.Conclusion
Chest HRCT should be considered for COVID-19 screening,
comprehensive evaluation, and follow-up, especially in areas with high
pretest probability for disease. In conclusion, the study demonstrates
that the CORADS scoring system is a useful tool for the initial
assessment of COVID-19, with CORADS scores 1 to 3 and 5 showing
a good correlation with RTPCR results. However, CORADS 4 did not
show a strong correlation with RTPCR findings, suggesting that it may
require additional clinical correlation for accurate diagnosis. These
results underscore the importance of integrating imaging findings
with clinical evaluation, particularly for cases with ambiguous or
inconclusive CORADS 4 scores.
Conflict of interest:The authors declare that they have no
potential conflicts of interest.
References
Citation
Mehta R, Bagada A. Comparative Analysis of CORADS Score on HRCT Chest and RT-PCR Swab Test Outcomes in Suspected COVID-19 Cases – A Cross-Sectional Study. Indian J Appl Radiol. 2025;11(1): 208.