Research Article
An Estimation of Solid Waste Generation and Recycling and Composting Potential at Educational Facilities: A Case Study in Hue City, Vietnam
Do Thi Thu Trang1, Nguyen Phuc Thanh2 and Yasuhiro Matsui1*
1Graduate School of Environmental and Life Science, Okayama University, 3-1-1 Tsushima-naka, Kita-ku, Okayama-shi, 700-8530 Japan
2Technology Research Department, Engineering Business Division, Hitachi Zosen Corporation, 15th Floor, OMORIBELLPORTD-wing, 26-3 MINAMI-OHI 6-Chome, Shinagawa-ku, Tokyo 140-0013, Japan
Corresponding author: Yasuhiro Matsui, Graduate School of Environmental and Life Science, Okayama University, 3-1-1 Tsushima-naka, Kita-ku, Okayama-shi, 700-8530 Japan; E-mail: matsui@okayama-u.ac.jp
Citation: Trang DTT, Thanh NP, Matsui Y. An Estimation of Solid Waste Generation and Recycling and Composting Potential at Educational Facilities: A Case Study in Hue City, Vietnam. J Environ Soc Sci. 2016;3(1): 121.
Copyright © 2016 Trang DTT, et al. This is an open access article distributed under the Creative Commons Attribution License, which permits unrestricted use, distribution, and reproduction in any medium, provided the original work is properly cited.
Journal of Environmental and Social Sciences | Volume: 3, Issue: 1
Submission: 30/05/2016; Accepted: 23/06/2016; Published: 27/06/2016
Abstract
This study was undertaken to characterize the solid waste generation at educational facilities in Hue, Vietnam. The authors surveyed 35 educational facilities within six categories of schools for seven consecutive days. The waste generation rates by facility, student, classroom, staff member, and floor area were assessed by school category using the following three waste categories: general waste (GW), separated recyclables (SR), and separated food residue (SFR). To determine the potential for composting and recycling from the disposal amount, GW was classified and measured by 10 physical categories and 77 sub-categories. Plastic, paper, and food waste were dominant in most of the school categories. The total waste generated from educational facilities in Huewas determined by extrapolating the total number of facility/student in Hue and the waste generation rate by facility/student. The total waste generated was estimated to be 5.76 tons/day, of which 3.29 tons/day (57.2%) was GW, 0.15 tons/day (2.6%) was SR, and 2.33 tons/day (40.5%) was SFR. The authors also revealed a considerable potential to recycle and compost remaining in GW, at rates of 1.11 tons/day (19.3%) and 1.29 tons/day (22.4%), respectively. The total amount sent to a landfill could be reduced from 3.29 tons/day (57.2%) to 0.89 tons/day (15.5%). A detailed breakdown of the recycling and composting potential is also analyzed and discussed for use in policy making decisions. Through the Monte Carlo simulation, the 95% confidence interval of the totalwaste amount was estimated to be 4.85-7.71 tons/day.
Keywords: School waste; Recycling potential; Composting potential; Interval estimation
Introduction
The amount of municipal solid waste (MSW) generated inVietnam has been increasing in recent years. The amount of MSW was approximately 19 million tons in 2008 [1] and increased to 23million tons in 2014 [2]. The amount of waste is expected to increaseto 61.6 million tons by 2020 [3]. The rapid increase in MSW has posed significant challenges for Vietnamese solid waste managementauthorities. In addition, in 2015, the Vietnamese government issueda national strategy to manage waste and discarded material (Decreeno.38/2015/NÄ-CP), which indicated that daily-life solid waste mustbe classified and stored according to the following three categories:biodegradable organic, reusable and recycled, and “other†[4].Determining the recyclable and organic amounts is indispensable forVietnam’s handling of waste in the years to come.
It should also be noted that some categories of waste are collectedby informal sectors in developing countries; these include recyclablesfor sale and leftover food waste for farmers to feed animals [5].A survey in Hanoi showed that recyclable waste accounted forapproximately 20% of MSW [6]. As for food residue, the estimatedamount of recycled food residue was 4.1% of the domestic wastecollected in Danang, Vietnam [7]. However, most previous studies inVietnam mainly focused on MSW collected by formal sectors [8-11].To design a comprehensive MSW plan, Vietnamese authorities needto determine the total material flow of MSW, including the wasterecovered by informal sectors.
Currently, MSW management in Vietnam has been empiricallyplanned without the use of reliable data, but it will include such datain the near future. Shortcomings in MSW data include inconsistenciesin definitions and collecting data; lack of unification in reporting dataamong the municipalities; and differences in the amount of wastegenerated, which makes predicting trends difficult [1]. As someprevious studies have mentioned, it is important to understand theamount of waste generated, the waste composition, and the wastestream as the first step in developing an effective MSW strategy thatincludes 3R promotion (reduce, reuse, recycle) [12,13].
MSW is generated and discharged from various sources:households; commercial sources like hotels, restaurants, and markets;and institutional sources like educational facilities, medical facilities, and offices. To promote the 3Rs, it is indispensable for all members of society to separate valuable items such as recyclables and food residue. In particular, the public sector is responsible for raising awareness and promoting waste separation. Educational facilities could assume a role in educating individuals, and take the lead in 3R promotion.
Previous studies have investigated the generation of wastefrom educational facilities, but some studies have focused only onuniversities [14-16], and other studies have surveyed waste fromprimary and secondary schools [17,18]. They did not cover all schoolcategories from nursery school through university. One study inVietnam surveyed waste from educational facilities, but the study did not provide details on waste composition, the potential for recyclingand composting, or waste collected by informal sectors [19].
In order to provide the scientific information that can contributeto the promotion of the 3Rs at educational facilities, this study aimedto provide a detailed description of the solid waste generation andcomposition from educational facilities in Hue, Vietnam. The authorssurveyed six school categories, ranging from “Day-care center†to“College & University, “including “Private tutoring,†accordingto “The system of economic branches of Vietnam, 2007†[20], andanalyzed differences by category. The authors conducted a survey onthe waste collected by formal sectors, and also measured the amountof separated recyclables and food residue collected by informalsectors. The waste collected by formal sectors was classified into 10physical categories and 77 sub-categories to identify the potentialfor recycling and composting the waste. This study also conductedan interval estimation of the total waste in Hue, and aimed to clarifythe reliability of collected data and improve future tasks throughuncertainty analysis.
Methodology
Research area and target educational facilities
Hue, the capital city of Thua Thien Hue province, located in thecenter of Vietnam, was selected as the study area. Hue is comprised of27 wards with a total area of 71.7 km2 and a population of 342,556 asof 2011 [21]. Hue is well known for its historical monuments, whichwere deemed World Cultural Heritage sites on December 11, 1993, bythe United Nations Educational, Scientific, and Cultural Organization(UNESCO) [22]. Regarding solid waste management, the amount ofcollected waste in Hue is reported to be approximately 210 tons/day.The collection rate in the entire city was about 89%, and 90-95% inurban areas, in 2011 [23].
There are a total of 402 educational facilities in Hue. The authorscovered six school categories according to “The system of economic branches of Vietnam, 2007â€: “Day-care center,†“Kindergarten,â€â€œPrimary school,†“Secondary school,†“College & University,†and“Private tutoring.†For the sample selection, the authors used the listsof schools by school category. For “Kindergarten,†“Primary school,â€â€œSecondary school, â€and “College & University, â€the lists providedthe number of students at each school. Thus, the authors sorted thelists by the number of students and chose target schools by systematicsampling. Regarding “Day-care center†and “Private tutoring,†thelists did not include data on the number of students at each school.Therefore, the authors chose target schools from the original listswithout sorting by systematic sampling. A total of 35 targets wereselected. The total number of facilities in Hue, the number of targets,and the description by school category are shown in Table 1.
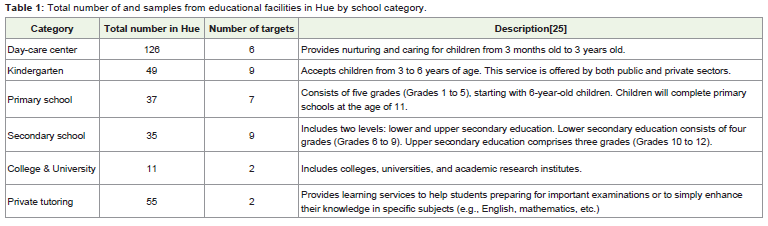
Table 1: Total number of and samples from educational facilities in Hue by school category.
Outline of survey
This survey focused on MSW and did not include construction and demolition waste, medical waste, or hazardous waste. Theprocedure for the waste generation survey followed the methodologypresented by Matsui et al. [24]. The authors conducted three surveys for all target facilities: a waste generation survey by actual measurement, awaste composition survey, and a questionnaire survey.
A waste measurement survey was conducted to acquire dataon the generation amount for seven consecutive days. Before thesurvey period, the authors spent three days to prepare and practicewith surveyors and target facilities. The target facilities separated thewaste into three categories according to their usual customs; wastecollected by formal sectors (hereinafter referred to as “general waste(GW)â€), recyclables sold to informal sectors (hereinafter referred toas “separated recyclables (SR)â€), and food residue sold/given to pigfarmers (hereinafter referred to as “separated food residue (SFR)â€).
The surveyors measured and recorded the amount of waste percategory (GW, SR, SFR) daily. The separation rates for recyclablesand food residue were as follows:
• Day-care center: 0% for recyclables; 0% for food residue
• Kindergarten: 33% for recyclables; 100% for food residue
• Primary school: 57% for recyclables; 86% for food residue
• Secondary school: 78% for recyclables; 67% for food residue
• College & University: 100% for recyclables; 100% for foodresidue
• Private tutoring: 0% for recyclables; 0% for food residue
The authors conducted a waste composition survey for GWduring the survey period. To acquire the information relating torecycling and composting potential contained in GW, the authorsclassified GW into 10 physical categories and 77 sub-categories. Thisclassification system was based on material (plastic, paper, kitchenwaste, rubber &leather, grass, textiles, metal, glass, ceramic, andmiscellaneous), type (container/packaging, product, and other), andpotential to recycle and compost. The recycling potential was based onthe practical trading status of the recycling market in Hue. Recyclableitems contained plastic, paper, glass, metal, and textiles that can bebought and sold at a recycling market. The composting potential wasbased on the acceptable items as determined by some compostingplants in Vietnam. Descriptions of waste classification categories areincluded in Table 2. The authors asked the persons in charge of facilitymanagement or waste handling to record the attributes and currentstatus of target facilities by using the structured questionnaire andthrough interviews. The questionnaire was designed to obtain detailedinformation on relevant factors (business-scale indicators) influencingwaste generation, recycling activities, and attitudes toward solid wastemanagement at each facility.
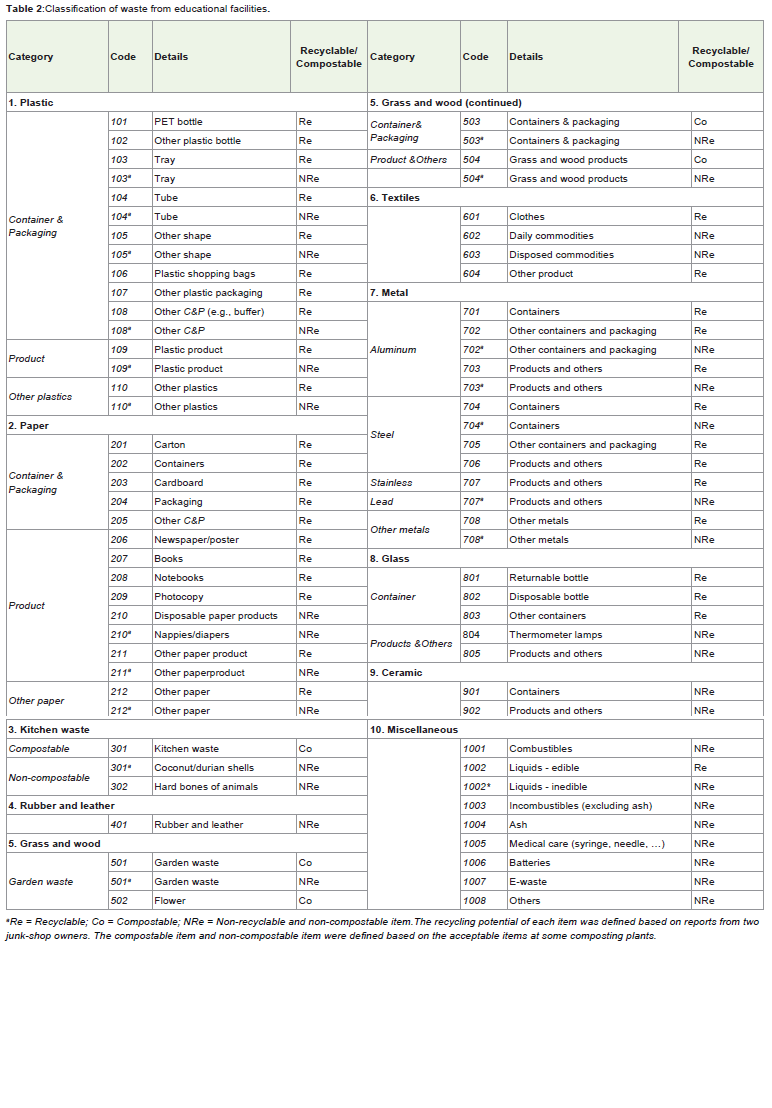
Table 2: Classification of waste from educational facilities.
Analytical procedure
The authors calculated basic statistics relating to waste generationrates (WGRs) by waste generation amount divided by five indicators:facility, classroom, baby/kid/student (hereinafter referred to as“Studentâ€), staff members (including lecturers, managers, researchers,and other people who provide service at educational facilities), andarea. The mean differences of WGRs of total waste among the sixschool categories were assessed by analysis of variance (ANOVA).The authors also calculated the coefficients of variations (CVs:standard deviations divided by means) of WGRs, and comparedthe CVs among five indicators. The CV was used as the indicator ofreliability in this study. The authors chose WGRs with smaller CVsamong five indicators for further analyses.
The waste composition of GW by percentage was calculatedaccording to the 10 physical categories by school category. In addition,based on 77 sub-categories, the authors assessed the recyclingand composting potential in GW. The total waste generated fromeducational facilities in Hue was determined through extrapolating bythe total number of facility/student in Hue and the waste generationrate by facility/student. (“Day-care center†and “Private tutoring†wereestimated by facility. “Kindergarten,†“Primary school,†“Secondaryschool,†and “College & University†were estimated by student). Theauthors also calculated the 95% confidence interval (CI) of the totalwaste generated by a Monte Carlo simulation (100,000 times) basedon the mean and standard error of the WGR by student/facility pereducational category. Monte Carlo simulations are used widely toassess error propagation for model parameters [26]. The uncertaintyof the result is affected by the uncertainty of the input data [27]. Theauthors intended to estimate the sensitivity as a percentage of thecontribution from each parameter to the variance of the final result[28].
Results and discussion
Waste generation rates of educational facilities
Table 3 presents the means and standard deviations (Mean ±SD) of WGRs of GW, SR, SFR, and total waste per school categoryaccording to the following indicators: daily amount at the facility (kg/facility/day), daily amount by student (g/student/day), daily amountby classroom (g/classroom/day), daily amount by staff member (g/person/day), and daily amount by area (g/m2/day). The authors alsoindicated the result of ANOVA on the mean difference among schoolcategories, as seen in Table 3. The result indicated that there weresignificant differences in WGRs by all indicators (p<0.001) amongschool categories.
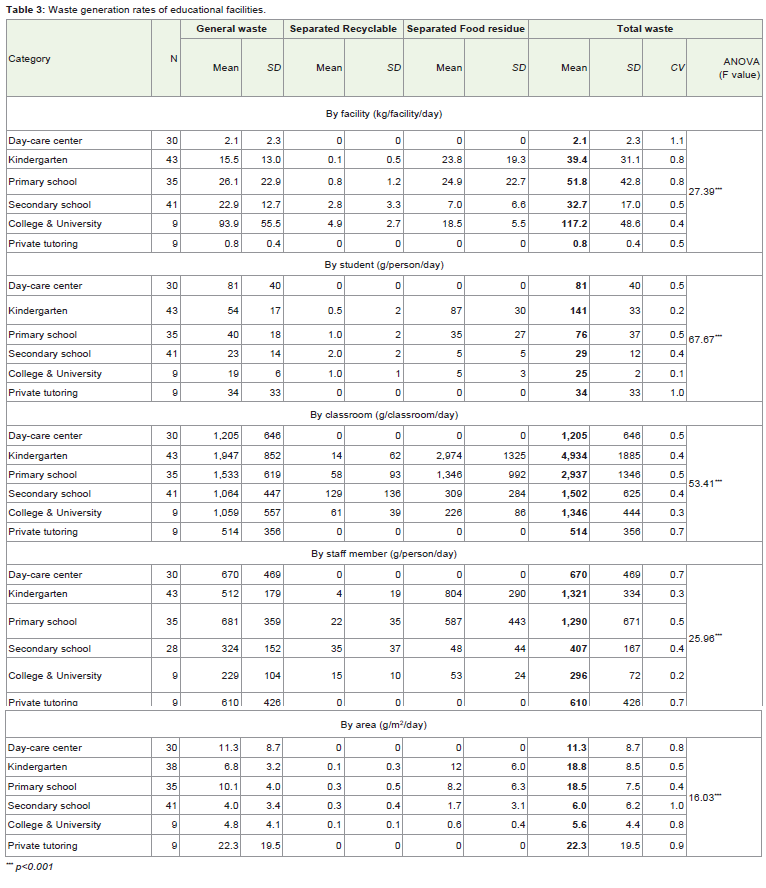
Table 3: Waste generation rates of educational facilities.
Regarding the total WGR by facility, “College and Universityâ€generated the largest amount (117.2kg/facility/day), followed by“Primary school†(51.8kg/facility/day), “Kindergarten†(39.4kg/facility/day), “Secondary school†(32.7kg/facility/day), and “Daycarecenter†(2.1kg/facility/day). “Private tutoring†generated thesmallest amount (0.8kg/facility/day). Regarding the total WGR bystudent, “Kindergarten†was the category with the highest WGR(141g/student/day), followed by “Day-care center†(81g/student/day) and “Primary school†(76g/student/day). The higher WGRsfrom “Kindergarten†and “Primary school†facilities were mainlyattributable to the large amount of SFR. The higher WGR at “Daycarecenter†facilities was considered to be due to the waste generatedin infant care, such as disposal diapers.
The total WGRs were smaller at “Secondary school†(29g/student/day), “College & University†(25g/student/day), and “Privatetutoring†(34g/student/day). The total WGRs in these categorieswere close to the reported value (21g/student/day) in a 2010 study inCambodia [18]. Table 3 also shows the CVs of WGRs for total waste.The WGRs by student had the smallest CVs in most of the schoolcategories. Therefore, the authors chose the WGR by student as therepresentative indicator for waste generation, which was used forfurther analyses.
Mean difference in waste generation rates by food serviceprovided
At “Primary schools,†some schools provided food service at theirown canteens, and others did not. The authors analyzed the meandifference of the WGR by food service provided by ANOVA, as shownin Table 4. The WGR for total waste differed significantly between“Primary school with food service†(85g/student/day) and “Primaryschool without food service†(25g/student/day). The difference wasconsidered to be due to the large contribution of SFR at “Primaryschool with food service†(41g/student/day). “Primary school withoutfood service†did not separate recyclables and food residue.
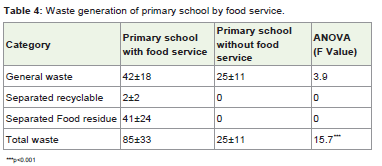
Table 4: Waste generation of primary school by food service.
Waste composition at educational facilities
Physical composition
Table 5 presents the composition of GW by 10 physical categoriesper school category. It was revealed that plastic, paper, and food wastewere dominant in most school categories. The results in this studywere in line with the following reported values on waste from schools in Ho Chi Minh City [19]: food residue ranged from 23.5% to 75.8%,followed by plastic, which ranged from 8.5% to 34.4%, and paper,which ranged from 1.5% to 27.5%. Food waste accounted for thehighest portion at “Kindergarten†facilities (54.8%), whereas it waslowest at “Secondary school†facilities (5.2%). This difference could beexplained by the fact that the entire “Kindergarten†category providedfood service, and some inedible cooking residue is discharged as GW.At the “Secondary school†facilities, the students rarely ate inside thebuildings. Paper accounted for a larger portion at “Day-care centerâ€facilities (47.5%), followed by “Private tutoring†(35.4%). Paper at“Day-care center†facilities was mainly baby diapers. This resultedin the lower recycling potential at “Day-care center†facilities. Grassand wood accounted for a large portion at “Primary school with foodservice†(15.2%), “Secondary school†(14.5%), and “Primary schoolwithout food service†(12.4%).
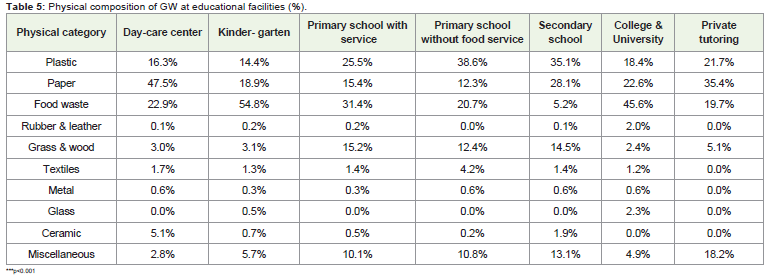
Table 5: Physical composition of GW at educational facilities (%).
Recycling and composting potential of general waste ateducational facilities
Although the educational facilities in Hue separated somerecyclables and food residue collected by informal sectors, somerecyclable and compostable portions were discharged as GW.The authors categorized each component of GW according to thepotential shown in Table 2, and aggregated the data by the followingcomponents: “Recycling potential in GW,†“Composting potential inGW,†and “Other residue in GW.â€
Table 6 presents the potential to compost and recycle and providesa detailed breakdown from GW by school category. “Compostingpotential in GW†accounted for a large portion, from 23.7% at “Daycarecenter†to 57.2% at “Kindergarten.â€Table 6 also shows that“Recycling potential in GW†accounted for a large portion amongeducational facilities, which ranged from 28.2% at “Kindergarten†to53.9% at “Private tutoring.†These results were similar toa 2009 studyat the University of Northern British Columbia, which indicated thatthe recyclable materials made up more than 37% of waste in mostof the activity areas on campus [29]. “Plastic C&P,†“Paper C&P,â€and “Paperproduct†showed higher contributions in recyclingpotential. “Kitchen waste†accounted for the highest portion in allschool categories, and “Garden waste†showed a higher contributionat “Primary school without food service,†“Primary school withfood service,†and “Secondary school†in composting potential. Topromote recycling and composting at educational facilities, these five items should be considered as major target items for initial separation.
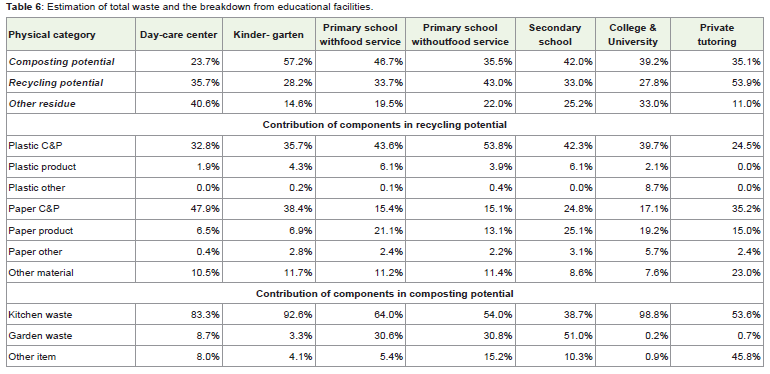
Table 6: Estimation of total waste and the breakdown from educational facilities.
Estimation of total waste generated from the educationalsector
To draw the total waste flow diagram of solid waste generatedfrom educational facilities in Hue, the authors estimated the totalamount of three components (GW, SR, SFR) from the educationalfacilities in Hue by each category. Additionally, the authors estimatedthe total recycling potential, composting potential, and residual foodamount in GW by the contribution of each component presented inTable 6 multiplied by the total amount of estimated GW amount.
Table 7 presents the estimation of total waste and the breakdownof the waste generated from educational facilities. The total wastegenerated from educational facilities in Hue was 5.76 tons/day, ofwhich 3.29 tons (57.2%) was GW, 0.15 tons (2.6%) was SR, and 2.33tons (40.5%) was SFR. The high percentage of SFR revealed that pigfarmers played an important role in MSW systems, recovering 40.5%of the total waste from educational facilities. Although the educationalfacilities achieved a certain level of recycling and separating of foodresidue, the GW still contained 19.3% that could be recycled and 22.4%that could be composted. Based on the comparison of the SR amountand the recycling potential by school category, it was suggestedthat the separated portion of recyclables was quite low, especially at“Kindergarten†and “Primary school†facilities; the amount of SR wasonly 0.01 tons (4.5%) in 0.22 tons of total recyclables and 0.03 tons(12.0%) in 0.25 tons of total recyclables, respectively. The compostingpotential was more than one-third the GW amount. Some paststudies have mentioned that organic waste is typically the heaviestcomponent of a waste stream and has the highest potential to emitgreenhouse gases once buried in a landfill [30]. The result of this studysuggested that the total disposal amount sent to a landfill could bereduced from 3.29 tons (57.2%) to 0.89 tons (15.5%) by recoveringthe recyclables and compostable parts within GW.
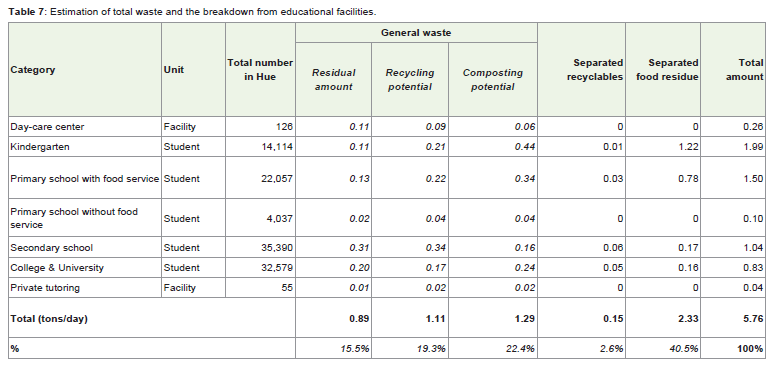
Table 7: Estimation of total waste and the breakdown from educational facilities.
Regarding the contribution from each school category,“Kindergarten†was identified as the largest generation source with1.99 tons/day, followed by “Primary school with food service†(1.5tons/day), “Secondary school†(1.04 tons/day), “College & Universityâ€(0.83 tons/day), and “Day-care center†(0.26 tons/day). The “Privatetutoring†category generated the smallest amount, with 0.04 tons/day.It is clear that the GW from “Secondary school,†“Primary school withfood service,†“Kindergarten,†and “College & University†categoriescontained larger recycling and composting potential. To promoterecycling and composting at educational facilities, these four schoolcategories should be considered as major targets to make separationan initial priority.
Interval estimation and uncertainty analysis of total wastegeneration from educational facilities in Hue
The 95% CI of the total waste amount from 402 educationalfacilities was also estimated by Monte Carlo simulation (100,000times) assuming normal distributions based on the means andstandard errors of the WGRs shown in Table 3. The results showedthat the range for a 95% CI was 4.85-7.71 tons/day.
The authors also examined the sensitivity as a percentage of the contribution from the WGR of each school category to the varianceof the total waste amount. Figure 1 presents the results of sensitivityanalysis on the total waste generated at schools. “SFA at primaryschool with food service†was identified as the category with thelargest impact on the CI of the total waste amount (55%), followedby “GW at primary school with food service†(16.8%), “GW at thesecondary school†(8.2%), and “SFR at kindergarten†(5.9%). Toimprove the reliability of the total estimation, the authors shouldstart by improving the data reliability at “Primary school with foodservice†by a further survey to increase the sample size and clarify theinfluencing factors on WGRs of SFR and GW.
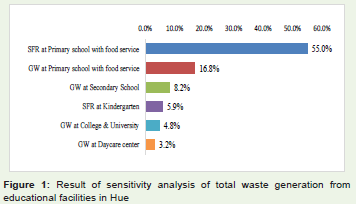
Figure 1: Result of sensitivity analysis of total waste generation from educational facilities in Hue.
Conclusions
1) This study aimed to provide a detailed description of the solidwaste generation and composition from educational facilitiesin Hue, Vietnam. The authors surveyed 35 educationalfacilities for six school categories over seven consecutive days.
2) The WGRs by facility, student, classroom, staff member, andfloor area were assessed by school category by three wastecategories: general waste (GW), separated recyclables (SR),and separated food residue (SFR).
3) The mean differences of WGRs of the total waste amongthe school categories were assessed by ANOVA. There weresignificant differences in WGRs by all indicators among thesix school categories.
4) GW was classified and measured by 10 physical categoriesand 77 sub-categories. Plastic, paper, and food waste werethe dominant forms of waste in most school categories.“Composting potential in GW†accounted for 23.7%–57.2%and “Recycling potential in GW†accounted for 28.2%–53.9%.
5) The total waste generated from educational facilities in Huewas estimated to be 5.76 tons/day, of which 3.29 tons (57.2%)was GW, 0.15 tons (2.6%) was SR, and 2.33 tons (40.5%)was SFR. GW still contained 19.3% that could potentially berecycled and 22.4% that could potentially be composted inthe total waste amount. The total disposal amount sent to thelandfill could be reduced from 3.29 tons (57.2%) to 0.89 tons(15.5%).
6) To promote recycling and composting at educationalfacilities, the key findings can be summarized as follows:
• Target waste items: According to the detailed breakdownof recycling and composting potential, plastic containers &packaging, paper containers & packaging, paper products,kitchen waste, and garden waste showed the highestcontributions.
• Target school categories: According to the estimated recyclingand composting potential, “Secondary school,†“Primaryschool with food service,†“Kindergarten,†and “College &University†contained the largest potential to recycle andcompost within GW.
The above mentioned items and school categories should beconsidered as the major policy targets for separation with the highest priority.
7) The 95% CI of the total waste amount was estimated to be4.85-7.71 tons/day. According to the sensitivity analysis, theWGRs of the “Primary school with food service†categorywere identified as having the largest impact on the CI of thetotal waste amount.
Acknowledgements
The authors sincerely thank the staff and students at HueUniversity for their assistance in this study. Special thanks to Dr.Pham Khac Lieu and Mr. Tran Ngoc Tuan who enthusiasticallysupported our survey. The authors also express their appreciationto the statistical office in Hue as well as all target schools for theircollaboration.
References
- National State of Environment (2011) Ministry of Natural Resources and Environment, Hanoi, Vietnam. Chapter 1 (in Vietnamese).
- Ministry of Natural Resources and Environment (2014) Proceedings of the 4th National Environmental Conference, Vietnam (in Vietnamese).
- World Bank (2012) What a Waste: A Global Review of Solid Waste Management.
- Vietnam’s national strategy on management (2015) Decree no. 38/2015/NÄ-CP.
- Hoang PC (2005) Audit of Solid Wastes from Hotels and Composting Trial in HaLong City, Vietnam. M.Eng. thesis, Department of Civil Engineering, University of Toronto, Canada.
- World Bank, MoNRE, CIDA (2004) Vietnam Environment Monitor, 65.
- Kato T, Pham DT, Hoang H, Xue Y, Tran VQ (2012) Food residue recycling by swine breeders in a developing economy: A case study in Da Nang, Viet Nam. Waste Management 32: 2431-2438.
- Ngo KC, Pham QL (2011) Solid waste management associated with the development of 3R initiatives: Case study in major urban areas of Vietnam. J Material Cycles and Waste Management 13: 25-33.
- Thanh NP, Matsui Y, Fujiwara T (2010) Household solid waste generation and characteristic in a Mekong Delta city, Vietnam. J Environ Manage 91: 2307-2321.
- Dan NP, Viet NT (2009) Status and strategies on solid waste management in Ho Chi Minh City. Int J Environ Waste Manag 4: 412-421.
- Thai NTK (2009) Hazardous industrial waste management in Vietnam: Current status and future direction. Journal of Material Cycles and Waste Management 11: 258-262.
- Bandara NJGJ, Hettiaratchi JPA, Wirasinghe SC, Pilapjiya S (2007) Relation of waste generation and composition to socio-economic factors: a case study. Environ Monit Assess 135: 31-39.
- Chang NB, Davila E (2008) Municipal solid waste characterization and management strategies for the Lower Rio Valley, Texas. Waste Manag 28: 776-794.
- Amutenya N, Shackleton C, Whittington-Jones K (2009) Paper recycling patterns and potential interventions in the education sector: A case study of paper streams at Rhodes University, South Africa. Resources, Conservation and Recycling 53: 237-242.
- Armijo de Vega C, Ojeda-Benitez S, Ramirez-Barreto E (2003) Mexican educational institutions and waste management programmes: a university case study. Resources, Conservation and Recycling 39: 283-296.
- Danielle PS, Arthur LF, Annie LB (2010) Reducing solid waste in higher education: The first step towards “greening†a university campus. Resources, Conservation and Recycling, 54: 1007-1016.
- Minnesota Pollution Control Agency (2010) A waste composition analysis of trash, recycling and organic material discarded at public schools in Minnesota.
- JICA, Kokusai Kogyo Co. Ltd. (2005) The Study on Solid Waste Management in the Municipality of Phnom Penh.
- Ministry of Construction (MOC) (2010) The master plan to develop municipal solid waste until 2025 of the Ho Chi Minh City. Ho Chi Minh City People’s Committee (in Vietnamese).
- Vietnam’s Prime Minister (2007) Decision 10-2007-QD-TTg of the Prime Minister: The System of Economic Branches of Vietnam.
- Hue Statistical Yearbook (2011) Statistical Yearbook, Hue city’s Statistical Office, Hue, Vietnam (in Vietnamese).
- ThuaThien Hue Provincial People’s Committee (2015) Management plan of the complex of Hue monuments for the period 2015-2020, vision 2030, 9-11 (in Vietnamese).
- HEPCO (2011) Report on Solid Waste Management of Hue City. Hue Urban Environment and Public Works State Company (in Vietnamese).
- Matsui Y, Do TTT, Nguyen PT (2015) Estimation of Waste Generation and Recycling Potential from Traditional Market: A Case Study in Hue City, Vietnam. J Environ Prot 6: 308-320.
- UNESCO (2011) World Data on Education.
- Huijbregts MAJ, Gilijamse W, Ragas AMJ, Reijnders L (2003) Evaluating uncertainty in environmental life-cycle assessment: a case study comparing two insulation options for a Dutch one-family dwelling. Environ Sci Technol 37: 2600-2608.
- Weir MJC (2002) Monte Carlo simulation of long-term spatial error propagation in forestry databases. In: Spatial Data Quality, Taylor & Francis: 294-303.
- Sonnemann GW, Schuhmacher M, Castells F (2003) Uncertainty assessment by a Monte Carlo simulation in a life cycle inventory of electricity produced by using a waste incinerator. J Clean Prod 11: 279-292.
- Felder M, Petrell R, Duff S (2001) A solid waste audit and directions for waste reduction at the University of British Columbia, Canada. Waste Manag Res 19: 354-365.
- Mason IG, Oberender A, Brooking AK (2004) Source separation and potential re-use of resource residuals at a university campus. Resources, Conservation and Recycling 40: 155-172.